A strategic financial dashboard designed to analyze corporate spending patterns, assess vendor concentration risk, and monitor Capital vs. Operational expenditure.
 (A comprehensive view of Q1-Q4 expense trends, departmental allocation, and vendor reliance.)
Infinity Tech required a solution to move away from static spreadsheets to a dynamic view of their financial health. This Excel-based tool ingests raw transactional data and transforms it into actionable intelligence.
Key Capabilities:
- Spend Classification: Automated breakdown of Capital (CapEx) vs. Operational (OpEx) expenses.
- Vendor Risk Analysis: Identification of top vendors to assess dependency.
- Departmental Auditing: Granular view of spending by department (IT, HR, Marketing, etc.).
- Trend Detection: Quarterly and monthly analysis to spot inflation or spending spikes.
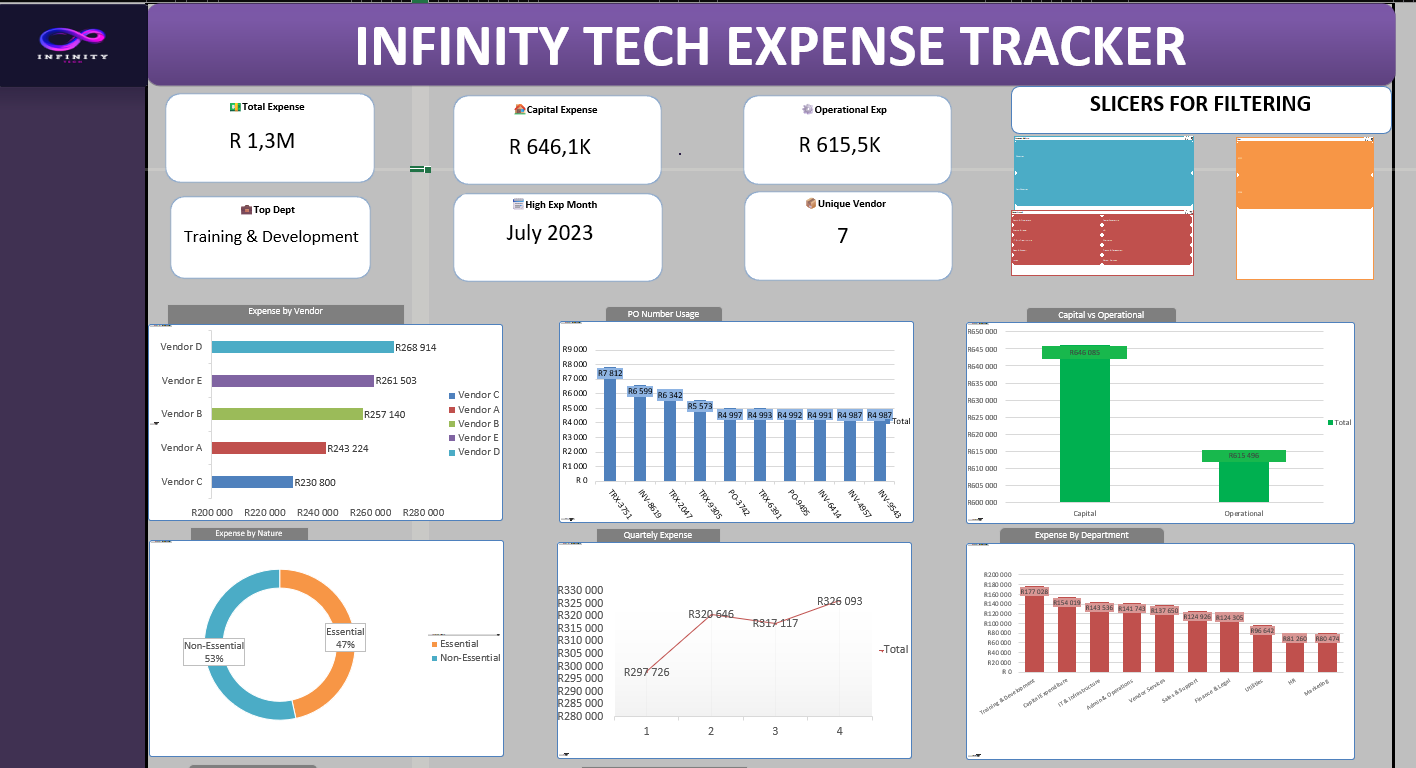
Based on the analysis of R1.3 Million in transaction data, the following insights were uncovered:
- The Split: Expenditure is split almost evenly: Capital (49.7%) vs. Operational (47.3%).
- Insight: The slight lean towards Capital spending suggests the company is in an investment/growth phase, heavily allocating funds to long-term assets rather than just maintenance.
- Top Heavy: Spending is highly concentrated. Three vendors (Vendor D, E, and B) account for over 60% of total procurement costs.
- Risk: This creates a high dependency. Any pricing changes or supply chain issues with these three vendors could significantly impact operations.
- High Spenders: Training & Development is the #1 cost center (~R177K), followed by IT Infrastructure.
- Lean Operations: HR and Marketing are operating with the lowest budgets (<R100K).
- Observation: While high training spend is good for culture, at >13% of the total budget, the ROI of these programs should be audited.
- The Gap: Non-Essential expenses (53%) currently outweigh Essential expenses (47%).
- Opportunity: This is the primary area for cost-cutting. Tightening discretionary spending could free up significant capital for strategic projects.
This dashboard demonstrates advanced Excel proficiency:
| Metric | Technical Approach |
|---|---|
| Dynamic Summation | SUMIFS used to toggle between Capital/Operational views. |
| Top Vendor Logic | INDEX + MATCH + MAX to dynamically pull the highest spender. |
| PO Utilization | COUNTIFS / COUNT to calculate the percentage of expenses backed by Purchase Orders. |
| Data Modelling | UNIQUE functions used to validate departmental lists. |
- Custom Number Formatting: Large figures formatted dynamically (e.g.,
###.0,,\Mfor Millions,###.0,\Kfor Thousands) for readability. - Interactivity: Slicers connected to multiple Pivot Charts for cross-filtering by Department, Vendor, and Time Period.
Corporate_Budget_Tracker.xlsx- The main interactive dashboard file (Includes Raw Data, Pivot Processing tab, and Dashboard).Dashboard-Screenshot.png- Preview image.
- Download: Clone the repo or download the
.xlsxfile. - Interact: Open in Excel. Use the Slicers on the left to filter by Department or Nature of Expense.
- Analyze: Hover over the trend lines to see specific monthly variances.
Bheki Mogola Aspiring Data Analyst turning numbers into business strategy.
📍 Connect with me: LinkedIn Profile