Process Book
A trend that’s steadily growing in society is the interest in the quantified self: the self as expressed by numbers, e.g. the number of hours slept, the number of steps walked, the concentration of calcium in the blood. Users interested in their quantified self will usually want to use this data to improve their lives - that is, they seek to use data about their biological lives to improve both their biological and psychological lives. For example, they may read about research concluding that drinking at least two liters of water a day will give them higher energy levels and a lower chance of diseases, so they might record water intake to check if they get to their two liters.
There is a big number of apps available in the iOS App Store that record variables of the quantified self. Some of these apps send their data to iOS 8’s newly introduced Health.app, which is a built-in app that acts as a hub for data gathered from participating apps. Categories are e.g. the above examples - hours slept, steps walked, concentration of calcium. Data collected in Health.app can then be forwarded to apps that request this data, though right now the collection of apps that make use of this feature is small. Apps that do make use of the feature do so in a trivial way: just like Health.app, they offer a historical look-up of one variable at a time. Using these apps, an user might see that their, for example, sleeping pattern has improved in the last two weeks, and suppose that this will be benefactory for their level of concentration, since sleep has been causally linked to concentration in past research. This research has an important limit - its conclusion is about the average person. The importance of sleep on an individual level is for most people - scientifically - unknown. This app seeks to change that.
This app, tentatively named Health, is only available for iPhone and iPod since iPad has no Health Kit for now. Its target is to apply a longitudinal research on the individual user to correlatively link quantified self-variables with each other.
This could have been done by using only data from the iPhone's & iPod Touch's Health Kit database, a centralized database in which apps may store and read data on certain variables. In this case, the app expects the user to already use Health Kit-enabled apps. This approach has two downsides. First, an app like this will only serve a very limited target audience. Second, an app like this is limited to Health Kit-supported variables. Psychological variables are not supported by Health Kit, though most users would be most interested in the correlation between biological variables and mood- or productivity-related variables. Some influential biological variables are missing as well, for example the amount of water that a user drinks.
The solution is thus to have a distinct database of variables that are not supported by Health Kit, but for which the user can input data directly within the app. Therefore, this app features a way to record mood throughout the day and to track sessions of productivity. It also features a way to record water intake throughout the day. The latter two function as small apps in themselves. These will be described in-depth in the Input section.
If the app consisted of only an input section and an analysis section, the user may well feel that too much is happening behind the screens. Insight in the data would be missing. Therefore, a log section felt necessary. In this section, the user can find out which variables are stored within the app, and, selecting a variable, find the daily score (which may either be an average or a total), and see a graph of daily scores for the past week, month, half year or year.
Different screens of input can be exchanged by swiping. The first screen is a mood-tracker, the second is a pomodoro-tracker, and the third is a water-tracker.
On this page, the user can input how they feel using a 5-point scale scoring system, which the user can configure to either show emoticons (😄), a number 1 (worst) to 5 (best), or a label ("Worst" to "Great"). If pressed, the current time in hh:mm scrolls out to convey that the value was saved for the current time.
On this page, the user is given a simple introduction in the pomodoro technique: work for 25 minutes, rest for 5 minutes, and repeat. This page is similar to a stopwatch: start the timer with the start/pause button; press again to pause, then choose between Continue and Stop (= reset). The user may see his progress in the progress bar, and in the number of minutes shown. Work period is conveyed with a red progress bar, while break period is conveyed with a yellow progress bar. After the first 25 minutes, the instructions message changes to a star. Then, after every work period a star is added to reinforce the user. The daily score is based on the number of stars gained.
On this page, the user can set a target amount of water he/she wants to drink per day. It is pre-set to 2,5 liter, which is the recommended amount for adult males. Then, using a scrolling picker, he can record an amount of water that he just drank. A blue progress bar conveys the progress to hitting the target amount. Once hit, the progress bar turns yellow to signify completion, and a second progress bar appears to show any water intake above target level. These events are of course reversible by setting a higher target amount.
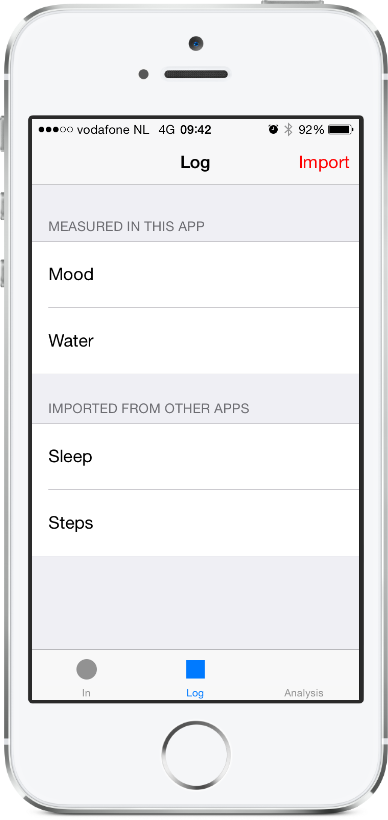
The log page contains all logged variables. It is divided (if applicable) in two sections: variables recorded within the app, and variables recorded without the app.
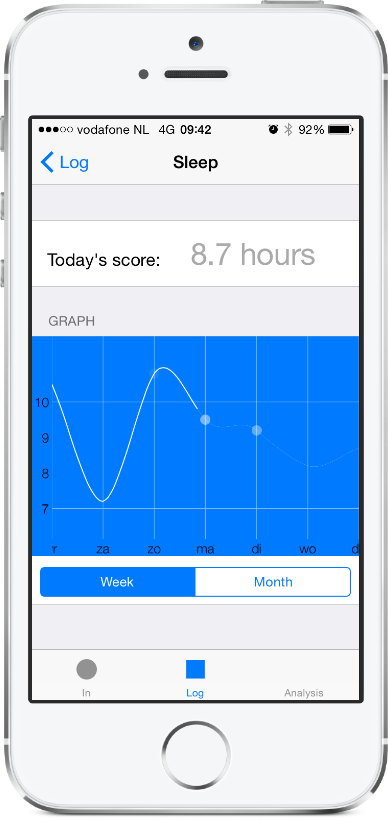
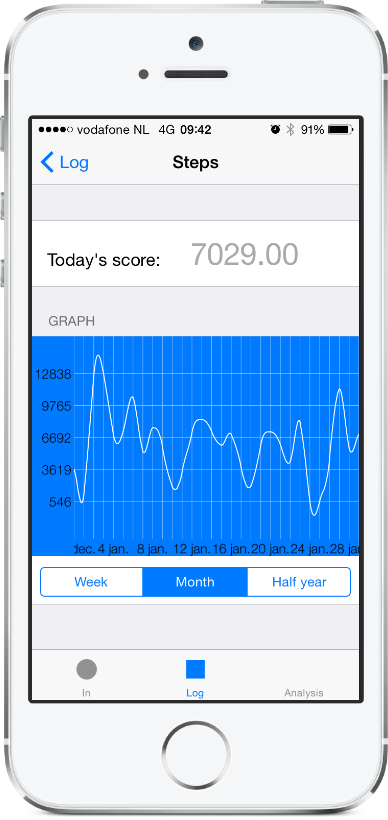
The variable stats page contains two forms of representation of the recorded daily scores. First, it gives the user the daily score of the current date. Second, it gives the user a graph showing the past daily scores. The graph gives the option to view by week or by month, though if enough data is available it will also show the option to view by half year or by year.
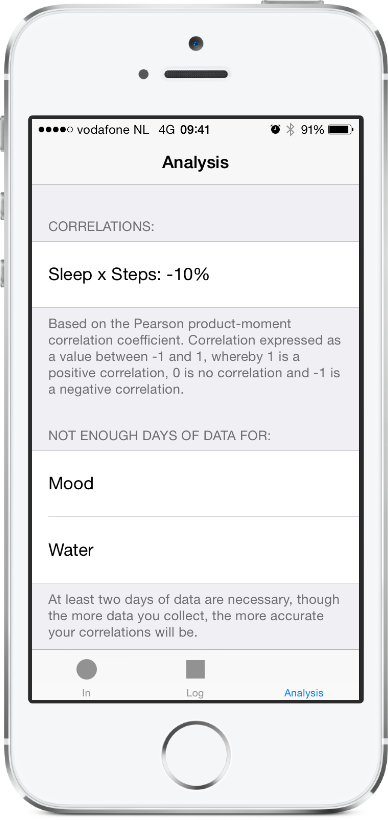
The analysis page contains a list of correlations between variables, shown as a percentage between -100% and 100%. Though this is not normal practice for Pearson correlation scores (which are usually given as a value between -1 and 1), using percentages will make the scores easier to understand for the average user. The analysis page also contains a list of variables (and couples of variables) that don't have enough data, with an explanation that more data is necessary.
In the future, these features may be added:
- more Health Kit variables to import
- import data directly from supporting apps
- correlation significance display
- causality analysis