

DevLake brings your DevOps data into one practical, customized, extensible view. Ingest, analyze, and visualize data from an ever-growing list of developer tools, with our open source product.
DevLake is designed for developer teams looking to make better sense of their development process and to bring a more data-driven approach to their own practices. You can ask DevLake many questions regarding your development process. Just connect and query.
| Run Locally |
|
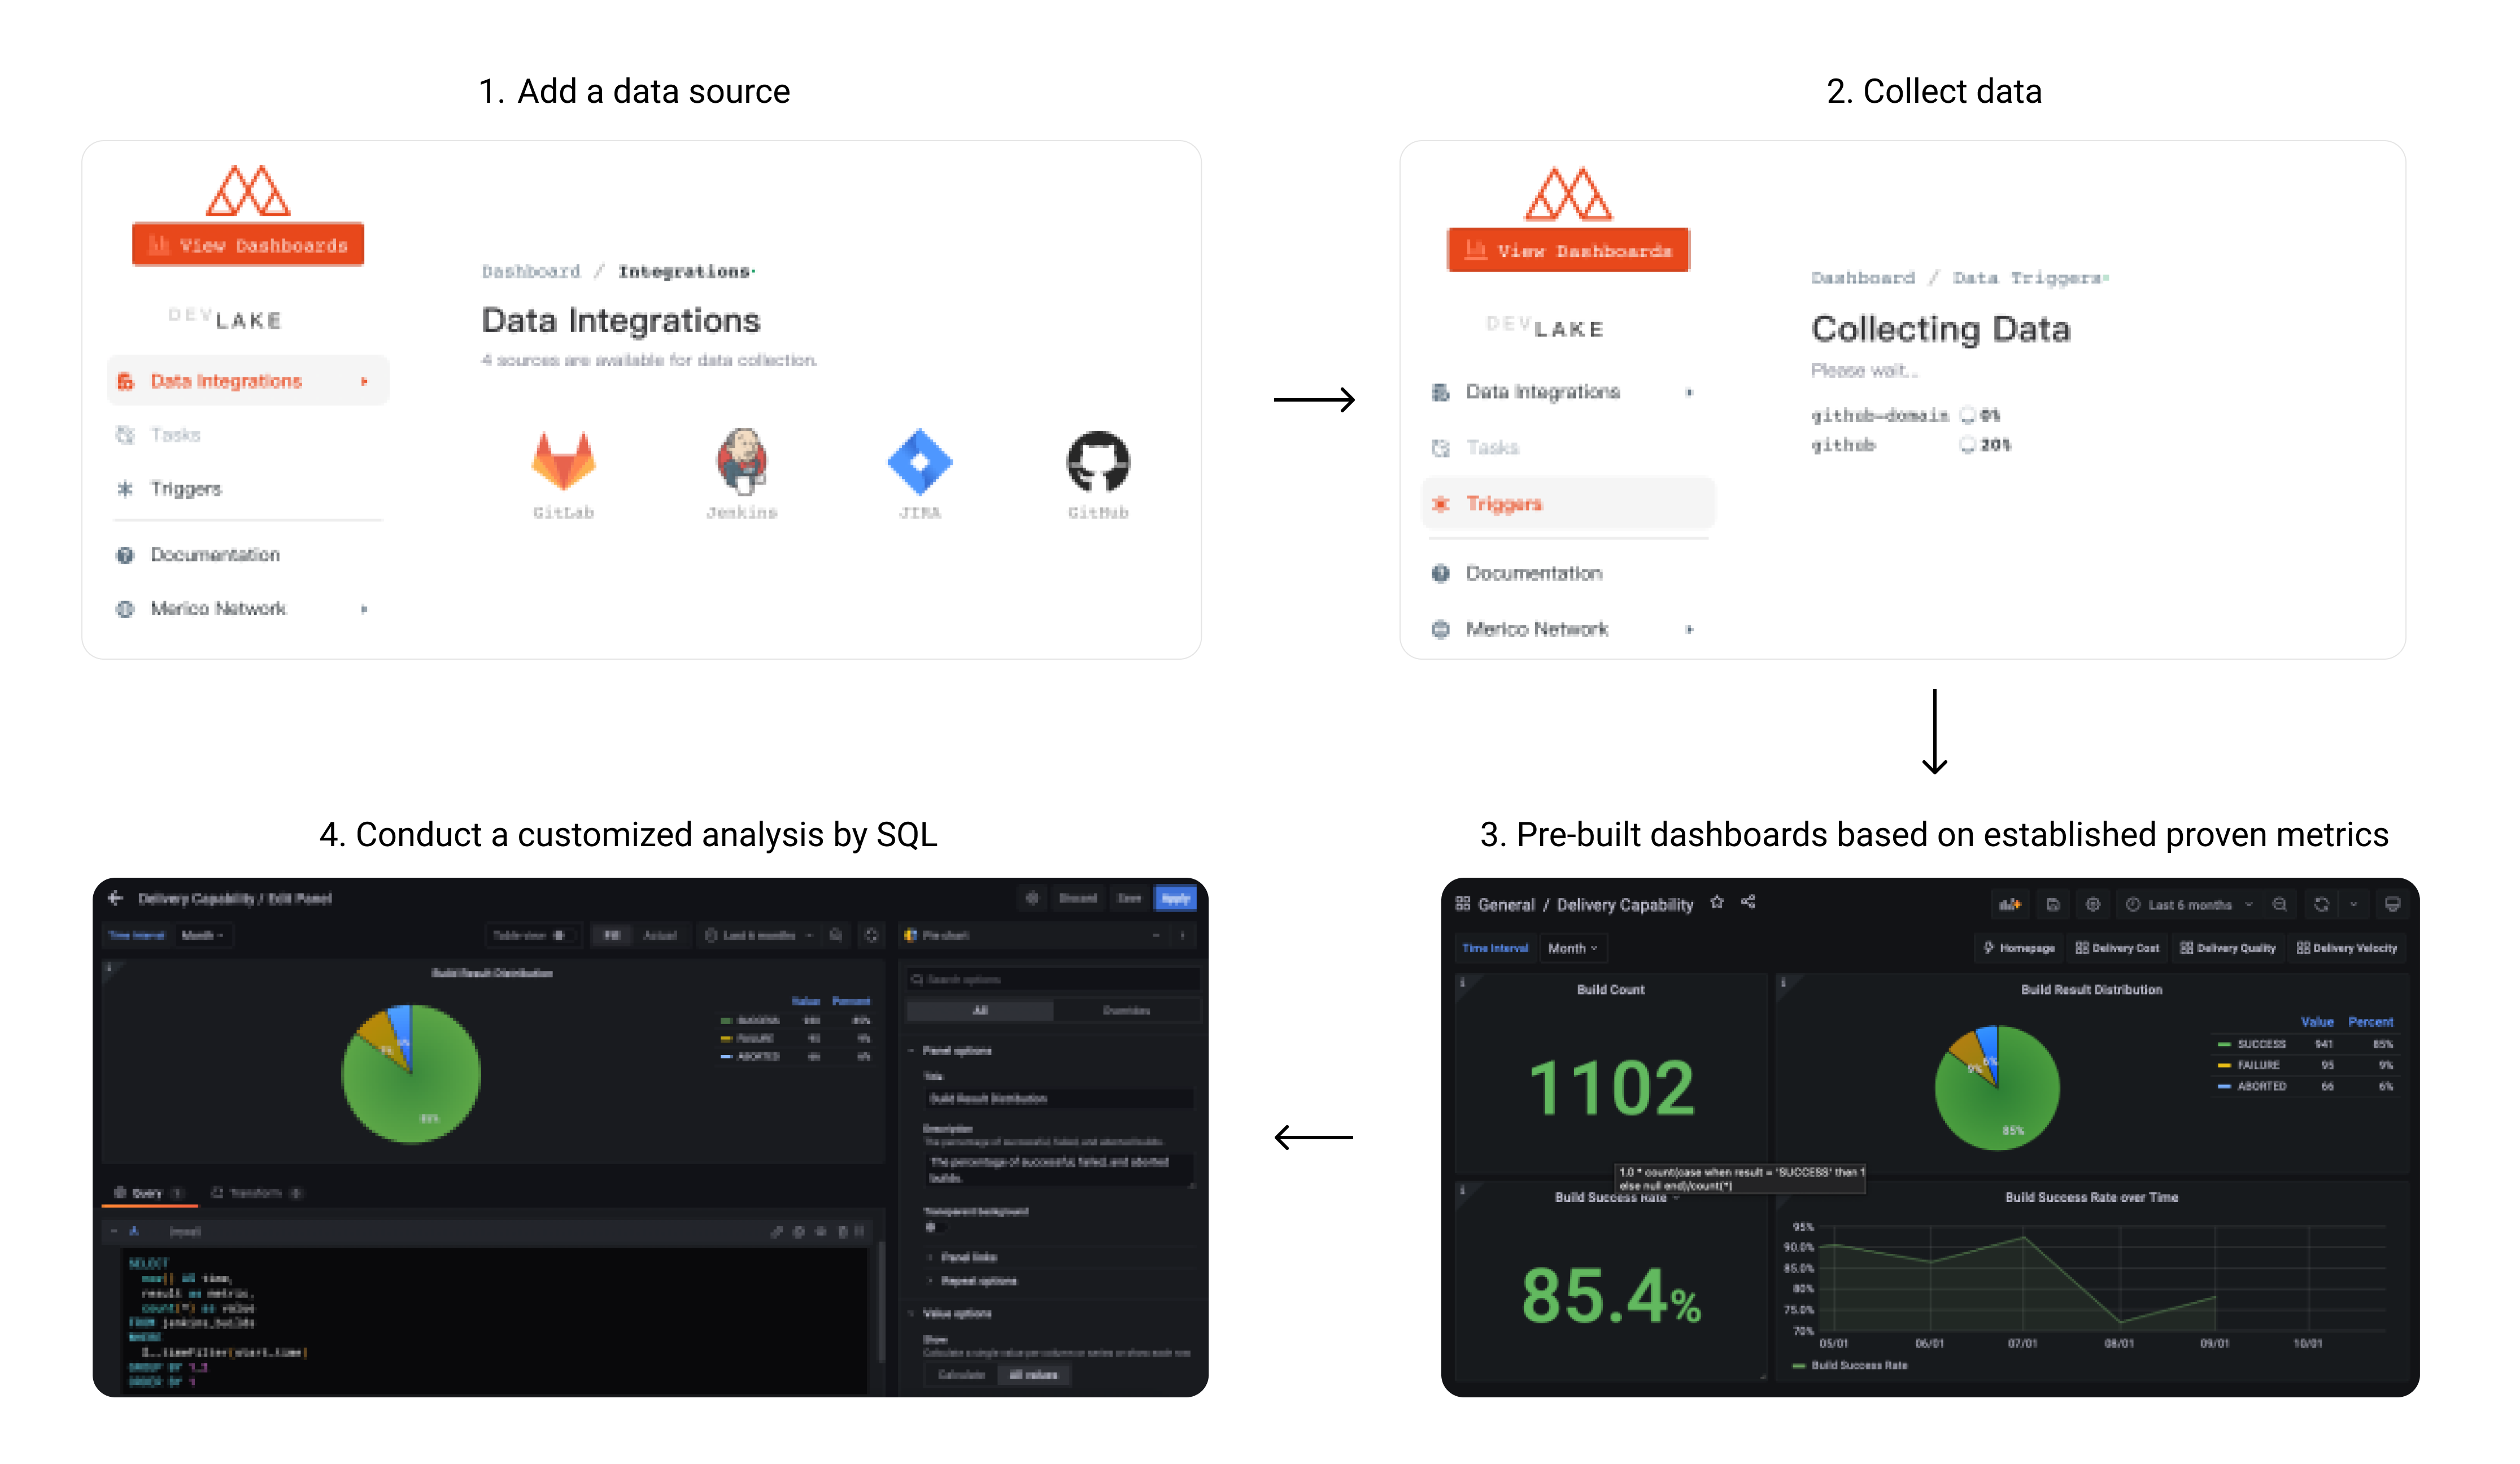
User Flow
- Comprehensive understanding of software development lifecycle, digging workflow bottlenecks
- Timely review of team iteration performance, rapid feedback, agile adjustment
- Quickly build scenario-based data dashboards and drill down to analyze the root cause of problems
- Collect DevOps performance data for the whole process
- Share domain layer with similar tools to output standardized engineering data
- Built-in 20+ engineering metrics and drill-down analysis capability
- Support custom SQL analysis and drag and drop to build scenario-based data views
- Flexible architecture and plug-in design to support fast access to new data sources
Click here to see demo. The demo is based on data from this repo.
Username/Password: test/test
- If you only plan to run the product locally, this is the ONLY section you should need.
- If you want to run in a cloud environment, click here.
- Commands written
like thisare to be run in your terminal.
NOTE: After installing docker, you may need to run the docker application and restart your terminal
IMPORTANT: DevLake doesn't support Database Schema Migration yet, upgrading an existing instance is likely to break, we recommend that you deploy a new instance instead.
-
Download
docker-compose.ymlandenv.examplefrom latest release page into a folder -
Rename
env.exampleto.env -
Start Docker on your machine, then run
docker-compose up -dto start the services. -
Visit
localhost:4000to setup configuration files.- Submit the form to update the values by clicking on the Save Connection button on each form page
devlaketakes a while to fully boot up. ifconfig-uicomplaining about api being unreachable, please wait a few seconds and try refreshing the page.- To collect this repo for a quick preview, please provide a Github personal token on Data Integrations / Github page.
-
Visit
localhost:4000/create-pipelineto RUN a Pipeline and trigger data collection.Pipelines Runs can be initiated by the new "Create Run" Interface. Simply enable the Data Source Providers you wish to run collection for, and specify the data you want to collect, for instance, Project ID for Gitlab and Repository Name for GitHub.
Once a valid pipeline configuration has been created, press Create Run to start/run the pipeline. After the pipeline starts, you will be automatically redirected to the Pipeline Activity screen to monitor collection activity.
Pipelines is accessible from the main menu of the config-ui for easy access.
- Manage All Pipelines
http://localhost:4000/pipelines - Create Pipeline RUN
http://localhost:4000/create-pipeline - Track Pipeline Activity
http://localhost:4000/pipelines/activity/[RUN_ID]
For advanced use cases and complex pipelines, please use the Raw JSON API to manually initiate a run using cURL or graphical API tool such as Postman.
POSTthe following request to the DevLake API Endpoint.[ [ { "plugin": "github", "options": { "repo": "lake", "owner": "merico-dev" } } ] ]Please refer to this wiki How to trigger data collection.
- Manage All Pipelines
-
Click View Dashboards button in the top left when done, or visit
localhost:3002(username:admin, password:admin).We use Grafana as a visualization tool to build charts for the data stored in our database. Using SQL queries, we can add panels to build, save, and edit customized dashboards.
All the details on provisioning and customizing a dashboard can be found in the Grafana Doc.
To synchronize data periodically, we provide lake-cli for easily sending data collection requests along with a cron job to periodically trigger the cli tool.
- Docker
- Golang v1.17+
- Make
- Mac (Already installed)
- Windows: Download
- Ubuntu:
sudo apt-get install build-essential
-
Navigate to where you would like to install this project and clone the repository:
git clone https://github.com/merico-dev/lake.git cd lake -
Install dependencies for plugins:
-
Install Go packages
go get
-
Copy the sample config file to new local file:
cp .env.example .env
-
Update the following variables in the file
.env:DB_URL: Replacemysql:3306with127.0.0.1:3306
-
Start the MySQL and Grafana containers:
Make sure the Docker daemon is running before this step.
docker-compose up -d mysql grafana
-
Run lake and config UI in dev mode in two seperate terminals:
# run lake
make dev
# run config UI
make configure-dev
-
Visit config UI at
localhost:4000to configure data sources.- Submit the form to update the values by clicking on the Save Connection button on each form page
-
Visit
localhost:4000/create-pipelineto RUN a Pipeline and trigger data collection.Pipelines Runs can be initiated by the new "Create Run" Interface. Simply enable the Data Source Providers you wish to run collection for, and specify the data you want to collect, for instance, Project ID for Gitlab and Repository Name for GitHub.
Once a valid pipeline configuration has been created, press Create Run to start/run the pipeline. After the pipeline starts, you will be automatically redirected to the Pipeline Activity screen to monitor collection activity.
Pipelines is accessible from the main menu of the config-ui for easy access.
- Manage All Pipelines
http://localhost:4000/pipelines - Create Pipeline RUN
http://localhost:4000/create-pipeline - Track Pipeline Activity
http://localhost:4000/pipelines/activity/[RUN_ID]
For advanced use cases and complex pipelines, please use the Raw JSON API to manually initiate a run using cURL or graphical API tool such as Postman.
POSTthe following request to the DevLake API Endpoint.[ [ { "plugin": "github", "options": { "repo": "lake", "owner": "merico-dev" } } ] ]Please refer to this wiki How to trigger data collection.
- Manage All Pipelines
-
Click View Dashboards button in the top left when done, or visit
localhost:3002(username:admin, password:admin).We use Grafana as a visualization tool to build charts for the data stored in our database. Using SQL queries, we can add panels to build, save, and edit customized dashboards.
All the details on provisioning and customizing a dashboard can be found in the Grafana Doc.
-
(Optional) To run the tests:
make test
- Roadmap 2022: Detailed project roadmaps for 2022.
- DevLake already supported following data sources:
- Supported engineering metrics: provide rich perspectives to observe and analyze SDLC.
This section lists all the documents to help you contribute to the repo.
- Architecture: Architecture of DevLake
- Data Model: Domain Layer Schema
- Add a Plugin: Guide to add a plugin
- Add metrics: Guide to add metrics in a plugin
- Contribution guidelines: Start from here if you want to make contribution
This project is licensed under Apache License 2.0 - see the LICENSE file for details.