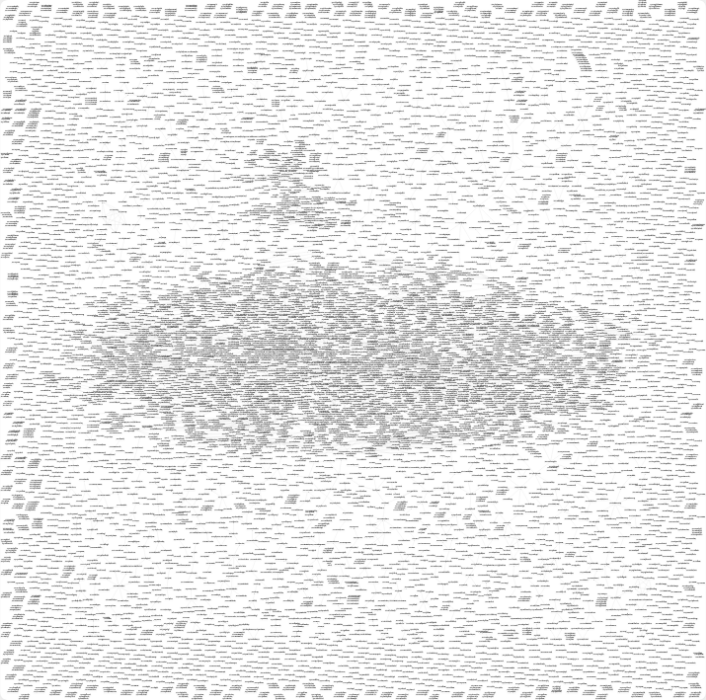
Generate a graph of your posts' cross-references.
Academic Labbook Plugin has a feature whereby it tracks links between posts ("cross-references"). These can be nicely visualised with a directed graph. This is a small script that produces an input file for graphviz which then produces a graph showing connections between posts.
On your computer:
- Python 3
- Graphviz
- python-graphviz (
pip install graphviz)
On your WordPress web server:
You must run a command on your web server using WP-CLI to generate a database dump, then copy and modify the example for the LIGO aLOG.
Run the following command on your server using WP-CLI...
wp db query "
SELECT posts.id, terms.slug, posts.post_title, posts.post_date
FROM wp_2_posts AS posts
INNER JOIN wp_2_term_relationships AS relationships
ON posts.id = relationships.object_id
INNER JOIN wp_2_term_taxonomy AS term_taxonomy
ON term_taxonomy.term_taxonomy_id = relationships.term_taxonomy_id
INNER JOIN wp_2_terms AS terms
ON terms.term_id = term_taxonomy.term_id
WHERE term_taxonomy.taxonomy = 'ssl-alp-crossreference'
" --url=https://example.com/my-blog/ > ~/relationships.dat
...replacing https://example.com/my-blog/ with the URL to your site, and the numbers in the table names (e.g. the 2 in wp_2_posts) with whatever your blog's site ID is (if WordPress is configured in network mode) or removing the numbers and one underscore entirely, e.g. wp_posts (if WordPress is configured in standard mode).
Copy relationships.dat to the same directory as this readme.
Copy alog.py and modify it for your own project (e.g. change the URL base to point to your own posts, or whatever). Run the resulting file with Python; this will produce something like alog.gv.svg. This is your graph.
