AKA DSLR - 42 Project
You can run the project locally. Make sure you have python installed. I used v3.9, other versions might work too but who knows. To install dependencies run:
pip3 install -r requirements.txt
You can also use the project with Docker. First, build the image:
docker build -t dslr .
Then, you can run the container like so:
docker run -it --rm dslr
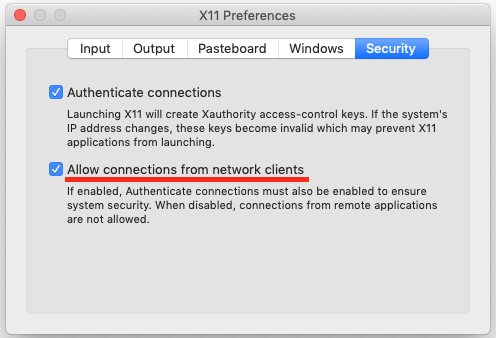
In the container, all dependencies are installed. However, you might have problems with plotting the data due to display forwarding. To make it work (for Mac, not Windows, for Ubuntu see below) make sure that XQuartz is running and connection from remote clients is allowed:
Then on the host run:
xhost + 127.0.0.1
to allow window forwarding from localhost. That should do it.
On Ubuntu what might work is if you run:
xhost + local:root
docker run -it --rm --env="DISPLAY" --volume="/tmp/.X11-unix:/tmp/.X11-unix:rw" dslr
Not sure about other Linux systems. Sorry 😢
I kept .devcontainer directory with a setup for development using VSCode Remote Development extension. You can reopen the project directory using the extension, similarly to using Docker container but with more functionality.
To display statistics about features in a dataset run:
python describe.py [-h] [--to-file] [--output-filename OUTPUT_FILENAME] filename.csv
To display the histogram of the score distribution of the most homogeneous feature run:
python histogram.py [-h] [--all] filename.csv
To display the scatter plot of the two most similar features run:
python scatter_plot.py [-h] filename.csv
To display the pair plot between all features run:
python pair_plot.py [-h] filename.csv
To train the model run:
logreg_train.py [-h] [--cost-evolution] [--epochs EPOCHS] [--learning-rate LEARNING_RATE] [--features FEATURES [FEATURES ...]] [--features-select] [--test] [--split-percent SPLIT_PERCENT] [--seed SEED] [--random] filename.csv
Optional arguments:
-c (--cost-evolution)display cost evolution after training-e (--epochs) EPOCHSnumber of iterations for training-lr (--learning-rate) LEARNING_RATElearning rate for training-f (--features) FEATURE [FEATURES ...]list of features for training-fs (--features-select)display feature selector. -f option will be ignored-t (--test)display accuracy statistics after training. will split provided dataset by Pareto rule-sp (--split-percent) SPLIT_PERCENTfraction of dataset to be used for training (see --test)-s (--seed) SEEDseed to use for splitting dataset (see --test)-v (--verbose) VERBOSEverbose level
After training is complete, logreg_train.json is created with data necessary for prediction.
To sort students into Hogwarts houses (ain't it what we all are here for?) run:
python logreg_predict.py datasets/dataset_test.csv
File houses.csv will be created et voilà!
- Verbose
- Integrated model evaluation
- Choose epochs, learning rate
- Choose seed and dataset split ratio
- Display cost evolution
- Save describe.py result to file
- Docker
- Readme