
A collection of production-quality backtests built with backtest-kit. Each example demonstrates a distinct signal source, entry logic, and position management approach.
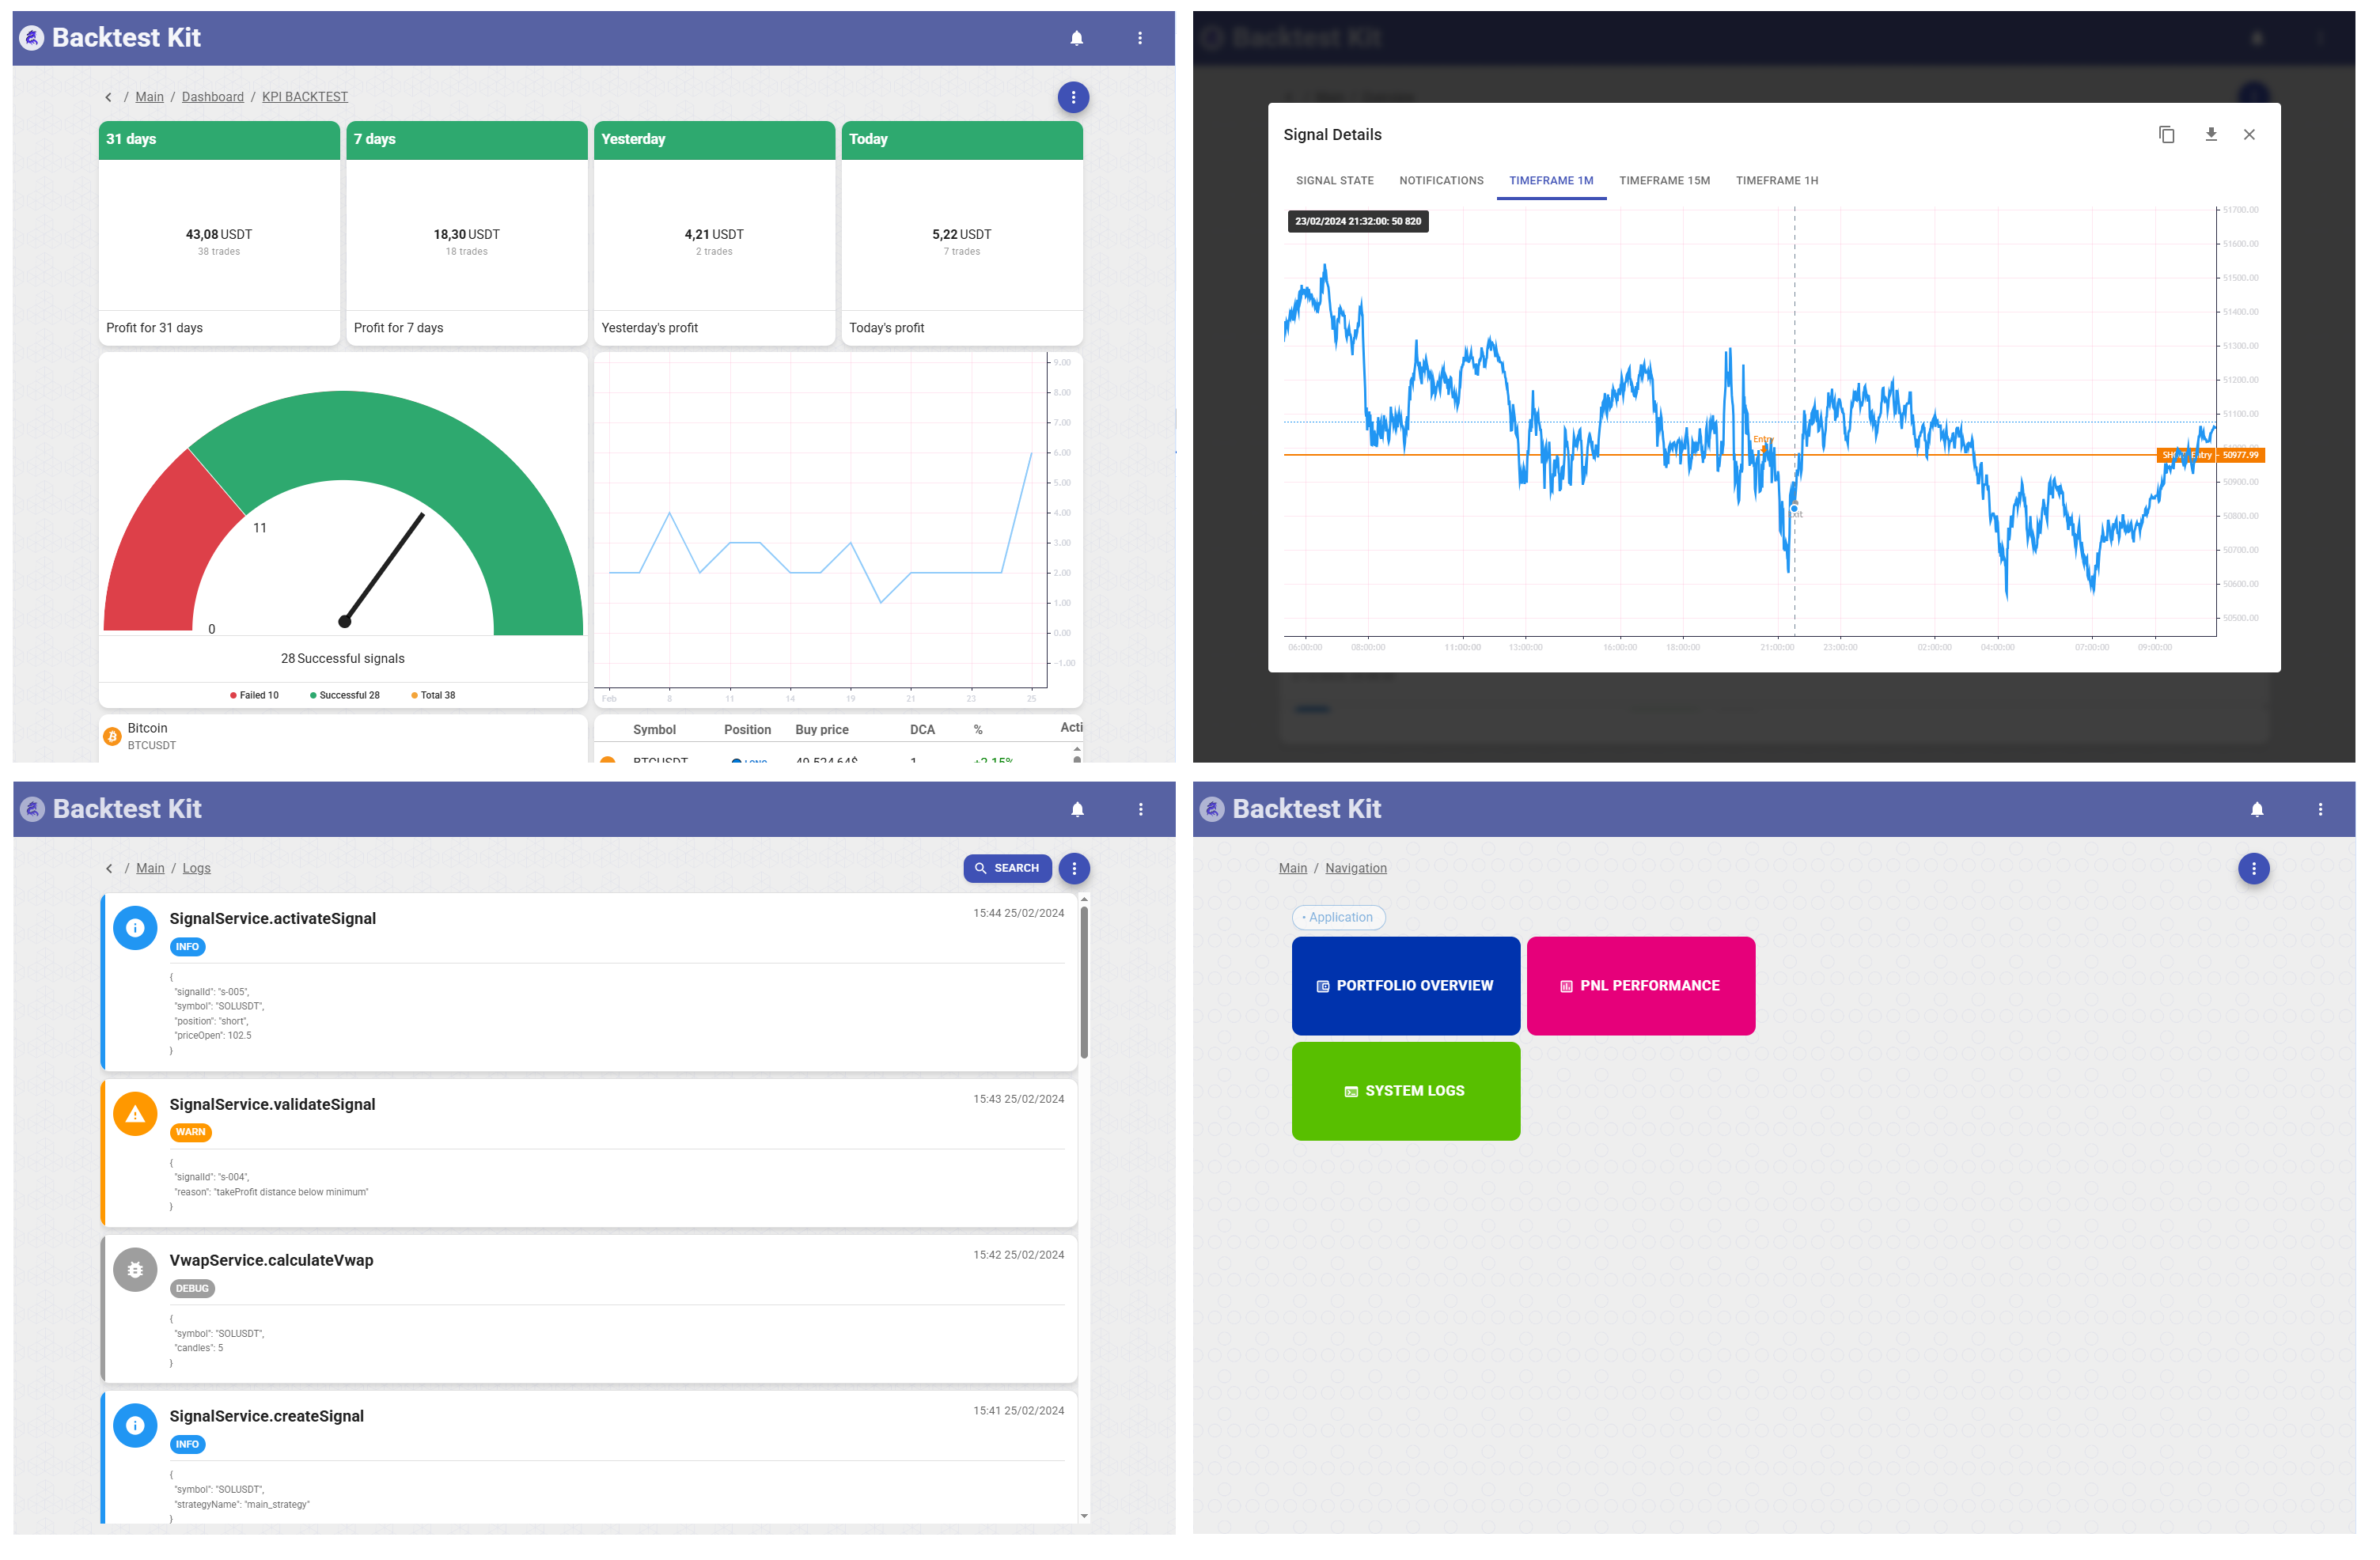




Link to the source code
npm start -- --backtest --symbol TRXUSDT ./content/jan_2026.strategy/jan_2026.strategy.ts| Strategy | Ticker | Period | Signal source | Net PNL | Sharpe |
|---|---|---|---|---|---|
| DOTUSDT Feb 2021 — Python EMA Crossover | DOTUSDT | Feb 2021 | Python EMA(9)/EMA(21) crossover via WebAssembly | +5.52% | 0.09 |
| BTCUSDT Apr 2024 — Polymarket Δprob | BTCUSDT | Apr 2024 | Polymarket "yes" probability shifts on crypto-prices markets | +0.63% | 0.055 |
| BTCUSDT Oct 2021 — TensorFlow Neural Network | BTCUSDT | Oct 2021 | TensorFlow NN predicting next candle close | +18.26% | 0.31 |
| BTCUSDT Dec 2025 — Pine Script Range Breakout | BTCUSDT | Dec 2025 | Pine Script BB + range detector + volume spike | +2.40% | 0.06 |
| TRXUSDT Jan 2026 — Liquidity Harvesting | TRXUSDT | Jan 2026 | Telegram channel signals (inverted) | +8.58% | 1.14 |
| BTCUSDT Feb 2026 — AI News Sentiment | BTCUSDT | Feb 2026 | LLM forecast on live news (Tavily + Ollama) | +16.99% | 0.25 |
| BTCUSDT Mar 2026 — SHORT DCA Ladder | BTCUSDT | Mar 2026 | Fixed SHORT gravebag signal + DCA ladder up (up to 10 rungs) | +37.83% | 0.35 |
| BTCUSDT Apr 2026 — DCA Ladder | BTCUSDT | Apr 2026 | Fixed LONG moonbag signal + DCA ladder down (up to 10 rungs) | +67.85% | 0.12 |
| BTCUSDT Jun 2026 — Crowd Liquidity | BTCUSDT | Jun 2026 | TradingView ideas, elite author whitelist trained by Simulator |
+19.80% | 0.64 |
Hypothesis: The Telegram channel publishes SHORT signals with average R:R of 0.375:1 and 106% deposit at risk at 25× leverage — mathematically guaranteed to lose. Fifteen minutes before each post a volume spike appears on the chart; the TP step multipliers and T5/SL ratio are identical across all signals, indicating an algorithm. If you reverse engineer the algorithm — liquidity is yours
- Signals are loaded from
assets/entry.jsonl— 11 real posts from the Crypto Yoda channel, exported verbatim. - On each candle,
getSignalchecks ifpublishedAtmatches the current minute and whetherclosePricefalls insideentry.from..entry.to. - Counter trend entry with trailing take and no fixed TP. SL is set to -0.5%
Hypothesis: public TradingView ideas are mostly noise, but a handful of authors are consistently right — and their posts move enough crowd liquidity to ride. If you grid-search the author ban rule itself (minimum track record × minimum hit rate) instead of hardcoding it, the whitelist reduces to a provable elite whose every post is a tradable signal.
scripts/simulator.mjsruns the framework'sSimulatorentity over the June ideas feed: one 5-day candle pass per idea, a 3,456-point grid (stop × trailing × hold × consensus × ban rule), flood dedupe (one idea per author per direction per 8h), default-ban for unproven authors.- All three rankings (time-based Sharpe, Sortino, PnL) converge on the strictest rule — ≥5 observed ideas at ≥60% hit rate — leaving 5 authors of 167. The whitelist and winning parameters land in
assets/sweep.report.BTCUSDT.json. getSignalenters on any post of a whitelisted author (N=1 — with an elite list, consensus is redundant: it fired only 4 times a month) viaPosition.moonbagwith a 4% hard stop.- Positions exit on a 2% trailing pullback from peak PnL (
listenActivePing+commitClosePending) or the 5-day hold cap. Result: 10 trades, 90% WR, +19.80% on a month where BTC itself fell −20.4%.
Hypothesis: an LLM reading live crypto/macro news every few hours can produce a directional bias (bullish / bearish / wait) that outperforms random on a sustained trending month.
- Every 4–8 hours, a Tavily search fetches the latest Bitcoin and macro headlines.
- The raw news text is passed to a local Ollama model, which returns one of
bullish,bearish, orwait. getSignalopens a LONG onbullish, SHORT onbearish, and skips onwait. A conflicting forecast while a position is open triggerscommitClosePending(sentiment flip).- Positions exit on trailing take-profit (1% drawdown from peak) or stop-loss (1% from entry). No fixed TP target.
Hypothesis: in a high-volatility, mean-reverting month, dollar-cost averaging into every spike upward raises the blended cost basis enough to hit a 0.5% profit target on each reversal.
getSignalopens a SHORT on every new pending signal viaPosition.moonbagwith a 25% hard stop and $100 cost.- While active,
commitAverageBuyfires on each ping if the current price moves outside a ±1–5% band around the last entry and fewer than 10 rungs have been added. - The position closes as soon as blended portfolio PNL reaches +0.5% via
commitClosePending.
Hypothesis: in a trending bull month, dollar-cost averaging into every dip lowers the blended cost basis enough to hit a 3% profit target faster and more often than a single-entry approach.
getSignalopens a LONG on every new pending signal viaPosition.moonbagwith a 25% hard stop and $100 cost.- While active,
commitAverageBuyfires on each ping if the current price falls outside a ±1–5% band around the last entry and fewer than 10 rungs have been added. - The position closes as soon as blended portfolio PNL reaches +3% via
commitClosePending.
Hypothesis: a simple feed-forward neural network trained on normalized candle patterns every 8 hours can predict next candle close position within its high-low range, enabling profitable entries when current price is below predicted price.
- Every 8 hours, the strategy fetches 58 candles (50 for training + 8 for prediction), trains a neural network (8→6→4→1 architecture) on normalized data.
- Normalization maps each candle's close to [0,1] as
(close - low) / (high - low), representing where the close sits within the candle's range. getSignalchecks every 15 minutes: ifcurrentPrice < predictedPrice, it opens a LONG viaPosition.moonbagwith $100 entry and 1% hard stop.- Positions close via trailing take-profit: when profit retraces 1% from its peak (e.g., position hits +3%, closes at +2%).
Hypothesis: Bollinger Band breakouts from a horizontal range, confirmed by a volume spike, and produce directional signals with positive expectancy on a choppy December.
- Every hour
Cache.fnrunsbtc_dec2025_range.pineon 1h candles (RSI 14) and extracts: BB bands, range boundaries,signal(±1),isRanging,volSpike. getSignalopens a LONG onsignal === 1or SHORT onsignal === -1, but skips if price has already moved past the close at signal time, or ifisRanging === 1.- Each position uses a fixed ±2% bracket (TP and SL), no DCA, no trailing.
Hypothesis: sharp daily shifts in Polymarket "yes" probability for BTC-related prediction markets reflect retail sentiment flow that precedes BTC spot movement by hours, with no look-ahead — only the timestamp and Δprob are used to choose direction.
loadPolySignalsreadsassets/polymarket-backtest-result.jsononce viasingleshot, aggregates to one signal per day (max|dprob|across all crypto-prices markets), and stripsentryPrice/exitPrice(future-data fields).getSignalpicks the most recent signal withtimestamp ≤ whenand rejects it if older than 1h or|dprob| < 0.10. Positive Δprob → LONG, negative → SHORT.- Entry via
Position.moonbagat market with a 1% hard stop and no fixed TP;listenActivePingcloses on 1% trailing drawdown from peak profit, or on the 24h timeout. - Result: 10 trades, 70% WR, Sharpe +0.065 — three SL hits (one per LONG on the April top) nearly cancel seven trailing-take SHORT wins on the recovery slope.
Hypothesis: A classic EMA(9)/EMA(21) crossover strategy executed via Python WebAssembly can capture short-term momentum reversals on 8-hour candles with fixed bracket orders.
- Every 8 hours,
Cache.fnruns the Python indicator (strategy.py) on 8h candles to calculate EMA(9) and EMA(21). - A signal fires based on EMA crossover and 4h range midpoint confirmation: if EMA(9) > EMA(21), open LONG; otherwise SELL.
- Each signal opens a $100 bracket position via
Position.bracketwith ±2% take-profit and stop-loss. - The strategy deployed $3,300 across 33 trades (all LONG), achieving +$5.52 (+0.17%) with a 63.6% win rate.