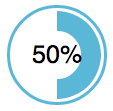
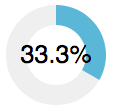
A very simple (responsive) circular chart/dial using Raphäel.
To use, include Raphäel, then pass an element with a number in it to the constructor. What you do with the CSS is up to you.
To give an example, you might do something like the following:
<!doctype html>
<html lang="en">
<head>
  <meta charset="UTF-8">
  <title>Circle Chart</title>
  <style>
    .circle-chart { width: 25%; position: relative; }
    .circle-chart__text { position: absolute; width: 100%; height: 100%; text-align: center; left: 0; top: 0; line-height: 4; font-family: sans-serif; }
  </style>
</head>
<body>

  <!-- Number goes inside a HTML element -->
  <div class="circle-chart">
    85%
  </div>

  <!-- Load the required libraries -->
  <script src="//cdnjs.cloudflare.com/ajax/libs/raphael/2.1.2/raphael-min.js"></script>
  <script src="js/circle-chart.js"></script>

  <!-- Create the chart -->
  <script>
    var el = document.querySelector('.circle-chart');
    new CircleChart(el);
  </script>
</body>
</html>You can pass an options object as a second parameter to the constructor. The defaults are something like the following:
{
    stroke:         20,         // Width of the circle (in pixels)
    maxVal:         100,        // Maximum value for the chart
    colour:         '#56b7d6',  // Colour of the circle (yes, with British spelling)
    animationSpeed: 1000,       // Time in ms for animations,
    edgeWidth:      0,          // Width of the border (zero means no border)
    edgeGap:        undefined,  // Gap between border and chart. Defaults to edgeWidth.
    edgeColour:     '#56b7d6',  // Colour of the border.
    trackColour:    'transparent', // Colour of the track beneath the chart.
    edgeClass:      'edge',     // class name for the edge
    trackClass:     'track',    // class name for the track
    pathClass:      'path',     // class name for the path
    pathEasing:     'ease-in-out'  // follows the naming convention of Raphael.easing_formulas
}
Released under the MIT License.


