The readme is still under construction. Please be patient as I am quite busy (lazy) at the moment. Veuillez patienter. Merci beaucoup!
This project is inspired by an article on oil-backed foreign exchange. When the oil exits the bear market, the currency exchange of oil producing countries would also bounce back. Does this statement really hold? Prior to this article by Bloomberg (or many other similar research), market analysts test the correlation between petrocurrency and oil price, instead of the causality. The issue is that correlation does not equal to causality. Correlation could be a coincidence of a math game. We simply cannot draw the conclusion that oil price moves the currency (the cause can be a third common factor such as inflation). Some researchers even introduce bootstrapping which, unfortunately, destroys the autocorrelation of time series. Thus, it is necessary for us to apply empirical analysis and computer simulation on various petrocurrencies to examine the underlying phenomenon.
The following figure is a global oil production choropleth. The map lists out a couple of petrocurrencies with potential arbitrage opportunities. What can be easily overlooked is that some of the oil exporting economies peg domestic currencies to US dollar. For the central banks, the peg eliminates the volatile currency risk for oil exporting. For the traders, the room for petrocurrency arbitrage is squeezed. So it is crucial to verify the exchange rate regime of any oil exporting country from wikipedia before moving onto any further analysis.

Unfortunately GitHub ReadMe does not support javascript. Click here to be redirected to an interactive version of the oil production choropleth.
In the original article by Bloomberg, the first mention is Norwegian Krone. Norway is one of my favorite places in Europe. Unlike Qatar or Saudi Arabia or any other Gulf/OPEC countries, the government doesn't heavily rely on oil or gas for its gross income (even though Equinor formerly Statoil is still a major player in Oslo Stock Exchange). According to wikipedia, over 60% of GDP is contributed by services in contrast to approximately 30% by industry in 2016 (arguably those services could still be oil-based like Dubai). Norway has established the largest sovereign fund in the world to hedge against oil price decline, ever since the discovery of north sea oil fields. Norway has non-petroleum industries such as fishing, maritime, renewable energy, etc. I doubt if oil price is the major driver of the exchange rate of NOK. I look into international trading statistics of Norway. Apparently, most trading partners are inside European Union. According to this report, I include Sterling and Euro into the price evaluation model of NOK. To my surprise, Norway actually does a lot of business with US. Hence, the model regressor consists of EUR, GBP, USD and Brent Crude. Arguably, the model should involve natural gas (Dutch TTF?) as well. From the website of norskpetroleum, Norway supplies 25% of EU natural gas demand (mainly France and UK).
After the identification of the model, we have to choose a base currency to evaluate NOK. It should be a stable entity with free floating FX regime with not much economic tie to Norway. I pick the safe haven currency in East Asia, Japanese Yen. In a released report by OEC, Japan only accounts for less than 2% of exports in 2017 which makes a perfect candidate. Then all regressors in the model would be priced in JPY. Our regressor variables become EURJPY, GBPJPY, USDJPY and Brent Crude in JPY. Our regressand variable is NOKJPY.
The data of the past five years is collected from Thomson Reuters (now called Refinitiv). We denote the time horizon before 2017-04-25 as training period. We use that period to fit a regression model. From 2017-04-25 to the end of our dataset is defined as testing period. We use our model from training horizon to predict "reasonable" range of the value of NOK in testing horizon. The regression result comes out as below. We have a pretty high R square. All T stats and F stats seem to be significant. As the summary suggests, there could be multicollinearity (condition number is large and R squared is large). Obviously, Brent Crude and US Dollar should be negatively correlated. Most commodity future contracts are priced in US dollar. When US dollar appreciates or depreciates, the underlying commodity price is likely to go the opposite direction. There could be a cointegration relationship between Sterling and Euro for pre-Brexit time as well.

In this case, we will use elastic net regression to implement regularization. Elastic net is a statistics/machine learning technique that consists of both Lasso (L1) and Ridge (L2) regression to act as a penalty. Ideally it is a perfect tool for multicollinearity issues.
Before backtesting, we ought to set up thresholds for signal generation. One sigma two-sided range is the common practice in statistical arbitrage. When actual NOK price goes above the upper threshold (larger than one sigma), we take a short position as we hold the belief that the price would fall back to its so-called "normal" status. Vice versa. However, the model is based on historical data. No models can precisely predict the future from the past. Our estimation is most likely to be overfitted and fail very quickly in the near future. We need to set up some thresholds for stop orders. When the model breaks, we could clear our positions and exit the trades gracefully. In that case, let's use another golden rule in statistics, two sigmas with 95% confidence interval, to do the trick. If NOK deviates 2 sigmas away from our fitted value, we need to realize the model is broken and we shall exit the trades right away. The figures below show the initial trading strategy. They demonstrate the positions of our statistical arbitrage and the actual price movement against the fitted value within confidence intervals.


To our surprise, there is a strong momentum after our model breaks. The momentum is independent of the selection of our training horizon. In another word, no matter which period we use as training horizon, the strong momentum always follows through right after the model breaks. The failure of this model doesn't really upset me. On the contrary, it is a blessing in disguise. What I see is an opportunity for trend following strategy! We will get back to that very soon.
What also interests me is why the model fails after 2017/11/15. Well, there is no way that a universal model can exist and work forever. Most models have short memory due to the dynamic environment of macroeconomics and geo-politics. Based on adpative market hypothesis developed by Professor Andrew Lo from MIT, the players in the market are always evolving along with the agile environment. Therefore, we should anticipate our model to lose its power sooner or later. Still, what is the cause of the break? For a quantamental analysis, we have only completed the quant part. I would not get into too much of rigorous and boring part of the fundamentals. Instead, I intend to bring up a short but insightful discussion here. What could possibly be the reason of this dramatic change? Could it be that Saudi and Iran endorsed an extension of oil production cap to boost up the oil price on that particular date? Or Donald Trump got elected as POTUS so he would encourage a weak US dollar and lift up restrictions on oil export as promised during his campaign? If we consider the price of NOK as a stochastic process, we can decompose NOK price into long term trend and short term random disturbance. Well, apparently short term is dominated by Brent Crude. It partially justifies our model. What really drives the long term trend though?

Ta-da, its Euro. As Norway is in EEA, its economic tie with EU totally dominates the long term trend of NOK. From the normalized figure, we clearly see the trend of both NOK and EUR are somewhat correlated. To get a formal conclusion, we need a cointegration test. Nevertheless, there is no Johansen Test in statsmodel package (not on the date when the first draft of oil money was finished, but there is now). We would have to use Engle-Granger two step test. I have to honorably mention that this method is co-developed by the mentor of my mentor, Robert F. Engle, a Nobel Laureate! Unfortunately, we can't get any confirmation of cointegration from the test. The residual of the first step regression is not stationary under Augmented Dickey-Fuller Test. Sometimes we have to use the old fashion way to make a qualitative judgement, which is rule of thumb. Most researchers in big organizations recalibrate their forecast with policy or experience or consensus views or simply instinct (as an insider, I guarantee you this is 100% true). This is the moment that I exercise my sacred right to declare that EUR is the driver of NOK's long term trend!

Well, I am not an economist (even though my work has a lot to do with them). I do not expect to really find out what happened on 2017/11/15 through our quantamental analysis. Let's call it an end to this twist (if you are an economics-savvy person who is eager to know more, feel free to read this paper by the Central Bank of Norway). In fact, we can simplify our model to NOK driven by Brent. From an econometrician's perspective, it does not sound like a good idea. Every coefficient of the model is statistically significant. Adding more variables does not worsen AIC, BIC or adjusted R squared. There is no incentive for us to remove variables as more information in the model is always better. From a trader's perspective, the model is supposed to work in a more general case. Ideally, the model contains two variables, one is the underlying petrocurrency, the other is the local crude oil contract. In this sense, the reduced form model can be applied to any petrocurrency without too much focus on analyzing trade partners or exporting products. We will take the trader's perspective in the following context.
Next, let's take a look at the portfolio performance. So far so good, we actually make a few bucks from statistical arbitrage. Interestingly, after we place the stop order, I decide to add an extra position to see what would happen if we follow the trend. In the figure below, we could see the downwards momentum doesn't stop until two months later (maybe another major event in financial market occurs).

Wow, did we just discover a momentum trading strategy! We started off this project to seek for a statistical arbitrage opportunity between crude price and petrocurrency. What we got in the end is an entry signal of momentum trading strategy. Also, we found out Euro is the major and long term influence on Norwegian Krone, and Brent Crude is the short term disturbance. My explanation for our discovery is that, when the model breaks, there must be something fundamental that change investors' outlook in NOK or Brent, e.g. an increase in north sea refinery capacity limit. That sort of change is supposed to last for quite a while which offers us a chance for trend following (this is how CTA makes money).


It turns out that our momentum trading is much more robust and profitable than our original idea of statistical arbitrage. But does it work on any other petrocurrencies? Unfortunately, Norway is one of the largest oil producing countries with floating FX regime. The rest are US, Russia and Canada. US dollar is a totally different case. Petroleum business only takes up a very small share in US economy even including shale boom in Permian Basin. What about Russian Ruble? Well, let's find out!
For Norway, I may have doubts in how much petroleum business contributes to its overall GDP. As for Russia, I doubt if any person in her/his rightful mind would question the role of oil in the economy of Russia. According to Wikipedia, Russian oil business (mostly Rosneft) accounted for 16% of GDP, 52% of federal budget revenues and over 70% of total exports in 2012. Usually, countries with large natural resource reserves suffer from Dutch Disease (USA is an exception), especially Russia! Hence, we don't need any extra step to validate if Russian Ruble is a petrocurrency.
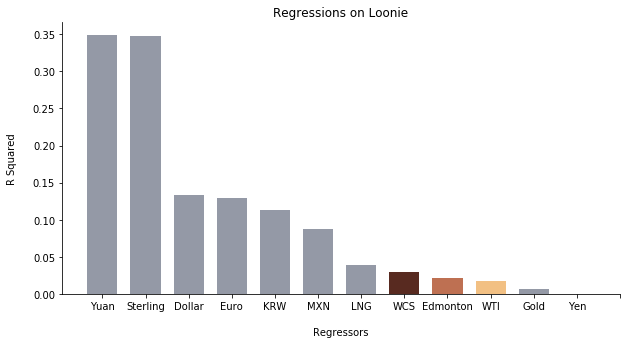
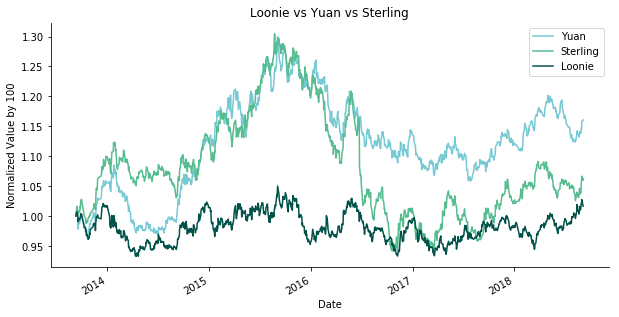
First step, let's identify the regressors. If we look at trade statistics, the biggest trading partners with Russia are EU, China, Ukraine, Belarus, Japan and Korea. Belarusian Ruble BYR is very strange. It has been pegged to both Russian Ruble and US dollar. But the central bank interferes the currency rate too frequently. I would argue the currency regime is a completely mess (thanks to oligarchs). I'd rather not include Belarusian Ruble as it is not a big player in global or regional economy. So we are left with Euro, Chinese Yuan, Ukrainian Hryvnia, Japanese Yen and Korean Won.
Australia, another country with rich natural resources, basically don't make many direct trades with Russia which is fantastic. We can use Australian dollar as the base to evaluate RUB,EUR,CNY,UAH,JPY and KRW. Instead of Brent, Russia has its own version of blending called Urals. We would take Urals spot price as a benchmark for oil. Apart from Urals, Russia also exports natural gas to Europe via Gazprom. The best benchmark for natural gas is Dutch TTF gas future contracts. When the tension of Nord Stream 2 pipeline is settled, the benchmark is probably gonna be German NCG gas future contracts (or maybe some extra benchmarks for South Stream and Power of Siberia). There we go, the preparation is done.
Yet, Russian Ruble is very special. Russia has been sanctioned by US and EU for so many times (really feel sorry for those innocent Russian civilians). To know when and what, someone actually creates a timeline for us. Each major sanction should make a huge impact on the currency. In this case, we use a method called stepwise regression to test each potential regressor for each year. We would pick out the R squared winners out of 7 variables from the past 4 years to construct a robust model. The figure below shows R squared of each variable for each year.

The figure below shows R squared of each variable for cumulated years.

Here are some interesting facts. Apart from Japanese Yen, Korean Won and Ukrainian Hryvnia, R squared year by year on other currencies or commodities are literally plunging from 2015 to 2018. The biggest cause is the sanctions. Ever since the annexation of Crimea, military intervention in Syria and nerve agent attack in UK, the sanction on Russia is getting more and more severe. Most countries except some rogue ones (e.g. China, Iran, Venezuela) decline to trade with Russia. Thus, we are able to observe the R squared downhill of Dutch TTF gas, Euro and Chinese Yuan over the years. Even though R squared on Urals jumps up in 2018, there is another key indicator that warns us of the danger. We would find out very soon. Before that, it is also strange that there are some spikes of R squared on Japanese Yen. My initial guess was that Japanese Yen became the safe haven for Russia turmoil. Frankly, it is more of a coincidence after some digging into the data. The spikes are simply because of the sluggish growth of Japan economy, which coincides with the downtrend of Russian Ruble. The same applies to Korean Won. As for Ukrainian Hryvnia, its R squared barely exceeds 20% so we simply ignore it. Now let us take a look at R squared of year cumulated. We could easily draw the same conclusion as before that R squared of most regressors are declining over the years (Korean Won looks like a bell shape curve though). 2017 and 2018 seem to be the roughest years for Russia. In that case, I prefer to split the backtesting data into pre-2017 and post-2017.
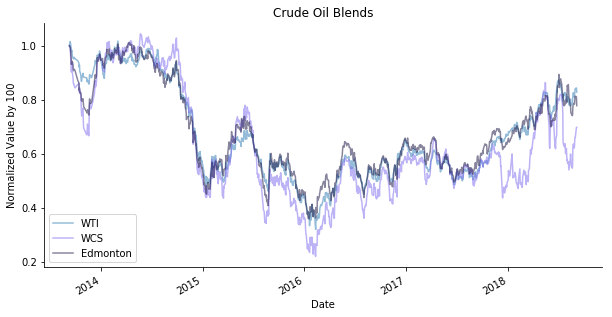
For pre-2017 data, the model seems to be very robust. Urals alone explains more than 80% of the price movement of Russian Ruble. The introduction of Euros into the model is optional. It indeed increases a significant amount (more than 2%) of R squared compared to other regressors. AIC, BIC and adjusted R squared also justifies the theory. Although in the following models, we would only include Urals Crude as a regressor. The reason behind that is to keep the model consistent across different currencies and different commodities (recalled from NOK section, we prefer trader's perspective).


For post-2017 data, we can tell this is when the sanction bites. Urals can only explain less than 30% of the price movement of Russian Ruble. Moreover, the coefficient of Urals is even negative which contradicts the fact that Russian Ruble is a petrocurrency.


If we track the price for Urals, Japanese Yen, Euro and Russian Ruble from 2017 and 2018, we will get a clear picture of how these assets move along the time axis. The stagnant performance of Japanese Yen and Euro implies the post-recession economy growth of two of the most influential blocs in the world. The surge of Urals from the beginning of 2018 does not translate into the performance of Russian Ruble. The sanction on Rusal which deeply disrupted aluminum market and the sanction in response to Russia’s gas attack on UK soil hit Russian Ruble further down.

In terms of trading strategies, Russian Ruble is too geopolitical event driven for any quantitative analysis. What we do here is trying to split the data of each year with a ratio of 30:70 into training and testing. We would apply whatever we have learned from the training dataset to backtest our momentum trading entry points. For the first two years, our model captures pretty solid R squared. The actual price of Russian Ruble barely drifts two standard deviations away from our forecast price. Nonetheless, there are two sides of this story. The good news is that our model identification is perfectly correct but the bad news is that our strategy only works when the model begins to break. We only want the model to be 80% correct instead of 100%! As an old saying goes, there is no way to beat the markets if the markets are fully efficient.


For 2017 and 2018, the R squared becomes total failures. It drops from less than 10% to less than 1% within 2 years. Still, you can argue that this strategy sort of works. When the model breaks in 2017, the downward pressure on Russian Ruble lasts more than a month. Although it sounds very tempting for the wide margin we can exploit, the R squared for that model is only 7%! Is it really worth the risk? I don't know what you folks think. I had a formal academic statistics training. A model with ridiculously low R squared and insignificant coefficients does not appeal to me. I strongly urge people to be cautious. When the model isn't robust (say R squared less than 50%), this trading strategy isn't plausible.


My conclusion for Russian Ruble is DON'T TRADE IT!! Its political agendas always screw up its petrocurrency status. A recent article by Financial Times justifies my theory. Trading is more like a marathon rather than a 100m sprint. I don't really think Russian Ruble is worth the risk. Is that it? Nope, lucky for us, we still have one more petrocurrency, Canadian Dollar, to test our strategies.