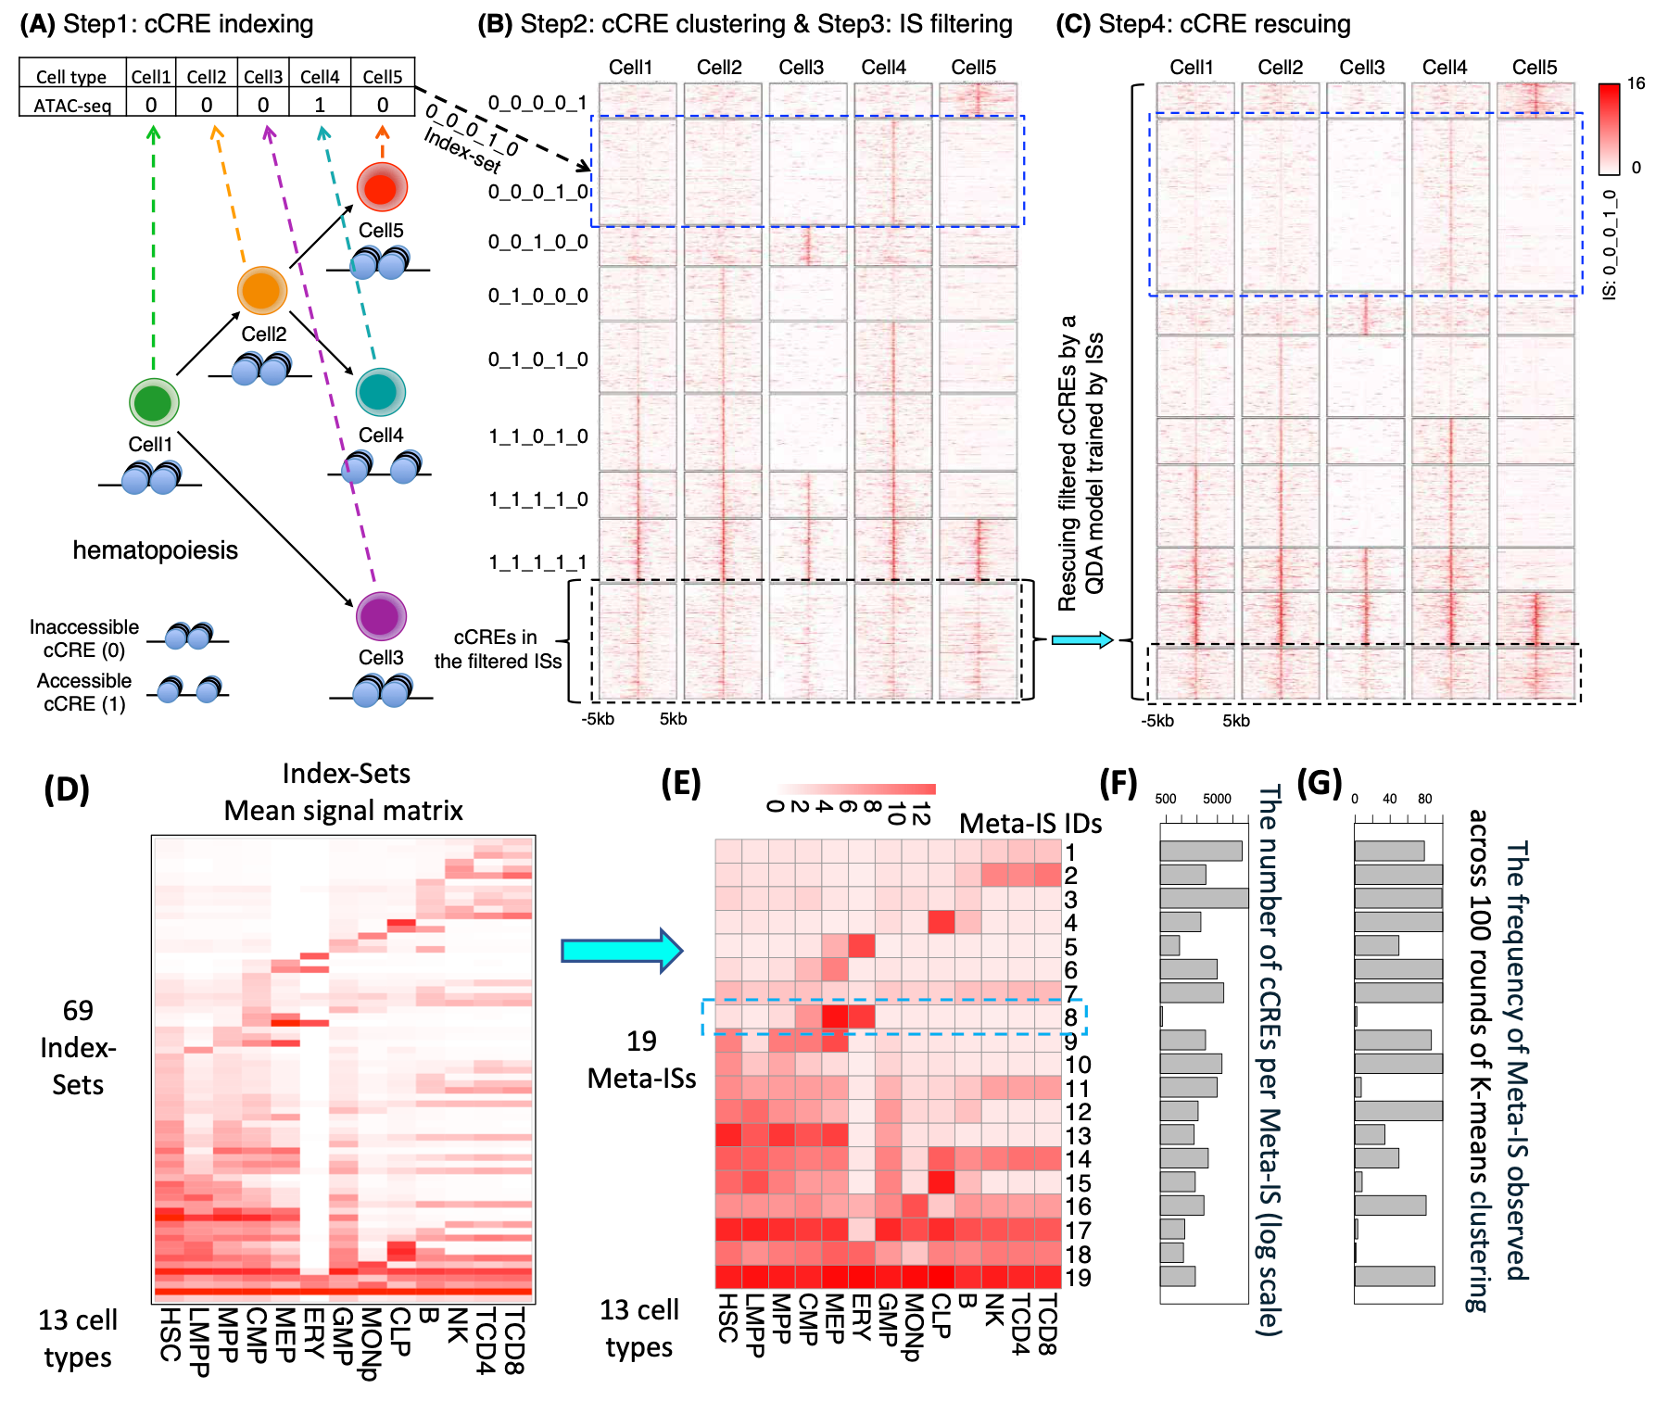
Here we developed a package, called Snapshot, for clustering and visualizing the cCREs and their functional epigenetic states during cell differentiation. The package uses a binarized indexing strategy for grouping each cCRE into different clusters (Fig. 1). The strategy guarantees to identify all binarized cCRE clusters in the data and further merges them into interpretable groups. It also automatically determines the number of clusters. Furthermore, the clusters and the corresponding dominant epigenetic states in each of the cell types can be visualized by incorporating the user provided cell-differentiation-tree, and thus can highlight the epigenetic history specific to any particular cell lineage.
 Overview of Snapshot. (A) Step1: cCRE indexing. A binarized index is created for each cCRE based on the presence/absence pattern of the cCRE across all cell types. (B) Step2: cCRE clustering and Step3: filtering. The cCREs with the same index were clustered into an Index-Set (IS). For example, the cCREs with 0_0_0_1_0 index were clustered into the IS in blue dash box. The cCREs in the less abundant ISs, highlighted by a black dash box, were filtered. (C) Step4: cCREs rescuing. The cCREs in the filtered ISs were re-classified as members of the abundant ISs based on their posterior probabilities of multivariate Gaussian distributions (using a Quadratic Discriminant Analysis (QDA) model) of the abundant ISs. The heatmaps in panels B and C were generated by deeptools [46]. (D) The mean signal matrix for all 68 abundant Index-Sets and an additional Index-Set, which included all remaining cCREs not assigned to an abundant IS. (E) The cCRE mean signal heatmap for the 19 Meta-Index-Sets (Meta-ISs) merged from 69 ISs. The number of Meta-ISs are automatically determined by AIC. (F) The barplot for the number of cCRE within each Meta-ISs in log scale. (G) The frequency at which the signal pattern of a of Meta-IS was observed in 100 rounds of K-means clustering.
The Snapshot Installation Guide can be found at Installation Guide.
User can choose to either directly input the index matrix, signal matrix, and functional epigenetic state matrix. The format for these matrices can be found at Input Matrix format.
Alternatively, the user can generate these matrices from raw data, including a peak bed file, a signal bigWig file, and a functional epigenetic state bigBed file. Information on how to use raw data as input for Snapshot can be found at Input format for Raw data.
Before running Snapshot, you need to provide the required input parameters and file paths in a run_snapshot.parameter.settings.info.txt file. The file should include the following information:
The details about the parameters and the alternative options can be found as Parameter Settings
cat test_data/run_snapshot.parameter.settings.info.hg38.ct13.txt
##################################
### required parameters or input files
output_name	snapshot_test_run_merge
peak_signal_list_file	peak_signal_state_list.merge.txt
IDEAS_state_color_list_file	function_color_list.txt
cell_type_tree_file	cd_tree.txt
genome_size_file	/Users/universe/Downloads/Snapshot_test/input_data_hg38/hg38.chrom.1_22XY.sizes

### required folder path
input_folder	/Users/universe/Downloads/Snapshot_test/input_data_hg38/
output_folder	/Users/universe/Downloads/Snapshot_test/input_data_hg38/hg38_outputs/hg38_chrAll_analysis_merge/
script_folder	/Users/universe/Documents/projects/snapshot/bin/

### optional parameters or input files
master_peak_bed	/Users/universe/Downloads/Snapshot_test/input_data_hg38/snapshot_test_run_merge.hg38.ct13.bed
min_number_per_indexset	0
normalization_method	S3norm
have_function_state_files	T

### input matrix
index_matrix_txt	/Users/universe/Downloads/Snapshot_test/input_data_hg38/used_input_matrix/snapshot_test_run_merge.index.matrix.txt
signal_matrix_txt	/Users/universe/Downloads/Snapshot_test/input_data_hg38/used_input_matrix/snapshot_test_run_merge.signal.matrix.txt
function_state_matrix_txt	/Users/universe/Downloads/Snapshot_test/input_data_hg38/used_input_matrix/snapshot_test_run_merge.function.matrix.txt
The Step1_run_Snapshot.sh script is a pipeline that runs the snapshot_v2.py program, which is the main component of Snapshot. The script read various required and optional parameters and input files in the run_snapshot.parameter.settings.info.txt file, which are passed as arguments to the snapshot_v2.py program. The following bash command can be use to run Snapshot:
### run Snapshot
time bash Step1_run_Snapshot.sh run_snapshot.parameter.settings.info.hg38.ct13.txt 2> run_snapshot.parameter.settings.info.hg38.ct13.log.txt
For the test data using matrice as input data, the Snapshot take 2min to run (Macbook Pro, Apple M1 Pro chip; 16GB RAM)
All output files will be put into the output_folder
- cCRE matrix signal matrix with Index-Set-IDs & Meta-Index-Set-IDs
- The 1st column is the cCRE chromosome;
- The 2nd column is the cCRE start_position;
- The 3rd column is the cCRE end_position;
- The 4th column is the cCRE IDs.
- The 5th column is the Index-Sets-IDs.
- The 6th column is the Meta-Index-Sets-IDs.
- The following columns are the signal of each cCRE at each cell-type.
>>> head snapshot_test_run_merge.IS_metaISid.mat.final.txt
#chr	start	end	cCREsID	IndexSetID	MetaISID	HSC	LMPP	MPP	CMP	MEP	ERY	GMP	MONp	CLP	B	NK	TCD4	TCD8
chr1	817200	817400	2	1_1_1_1_1_1_1_1_1_1_1_1_1	19	3.07654276210358	1.7674981111639	2.97586426982743	4.01022485628133	1.46555429101539	6.30258379077807	3.12816135307845	9.30050145599809	1.28600668043653	6.22340649321909	4.94431875212857	4.23782878500531	6.60696930732677
chr1	827400	827600	3	0_0_0_0_0_0_0_0_0_0_0_1_0	1	1	1	1	0.836000087438891	0.67860834949993	1	0.931005263532995	1.54793009110382	2.45270596319793	1.09925261516585	1	3.36381827277541	2.48940542090092
chr1	842000	842400	4	0_0_0_0_0_1_0_0_0_0_0_0_0	5	1.063223014105	1	1.3211282677192	0.836000087438891	0.839304174749965	4.55200252977152	1	1.15888694469843	1.11090027576689	1.12053271574453	0.939672479847708	1.20569409345875	1.05212032050987
chr1	842800	843200	5	0_0_0_0_0_0_0_0_0_0_0_1_0	1	1.12644495181709	1.35739954621571	1	1.8630743773467	2.04714182674103	1.23402191793215	1.13799064761242	1	1.11090027576689	1.80904969956321	1.12065606741823	2.53180045158971	1.44386838398805
chr1	858000	858200	6	0_0_0_0_0_0_0_0_0_1_0_0_0	3	1	1.62153455298404	1	0.836000087438891	1	0.838444381437752	1.15580229635762	1	0.935793871097245	4.11622744551984	1	0.947219330013239	0.895760246346107
chr1	865600	866000	7	0_0_0_1_0_0_0_0_0_1_0_1_1	7	1.66486637415515	1.35739954621571	1.45227847505644	2.13641087330604	1	4.50235489052356	1.87771266058955	3.37915585932396	1.79331007771761	3.17549611848783	2.97997417025989	6.21001152102035	4.53318644443564
chr1	869800	870000	8	1_0_1_0_0_0_0_0_0_0_0_0_0	10	3.22711936662464	2.54996646135659	3.30999468543546	1.44905196406984	1	1.23402191793215	1.33787745005449	1	1.28600668043653	1.07797251458716	1	1	0.895760246346107
chr1	897400	897600	9	0_0_0_0_0_0_0_0_0_1_0_1_1	1	1.53842142233806	1.29192711635972	1.64225765188592	1.2380697359342	0.67860834949993	2.02760161108699	1.87771266058955	2.01062706333476	1.11090027576689	1.94649882715279	2.69710707142715	4.33053980437253	4.98880443963098
chr1	904600	904800	10	1_1_1_1_1_0_1_0_0_1_0_0_0	12	5.26923047224513	14.0611210261117	5.15381893924735	4.82572836125573	2.72287385250705	1.3955775364944	5.81118557760322	4.06554107632315	3.33496820436231	4.61386162021539	1.29543280721009	1.25847476344551	1.1509968349721
- The bed file of each Meta-Index-Set and each Index-Set
### bed files for each Meta-Index-Set
ls -ltrh snapshot_test_run_merge_MetaISs_bed_files | head
total 5328
-rw-r--r--  1 universe    59K Feb  3 13:34 MetaIS.19.bed
-rw-r--r--  1 universe   469K Feb  3 13:34 MetaIS.1.bed
-rw-r--r--  1 universe    28K Feb  3 13:34 MetaIS.5.bed
-rw-r--r--  1 universe   635K Feb  3 13:34 MetaIS.3.bed
-rw-r--r--  1 universe   206K Feb  3 13:34 MetaIS.7.bed
-rw-r--r--  1 universe   197K Feb  3 13:34 MetaIS.10.bed
-rw-r--r--  1 universe    67K Feb  3 13:34 MetaIS.12.bed
-rw-r--r--  1 universe    87K Feb  3 13:34 MetaIS.16.bed
-rw-r--r--  1 universe    92K Feb  3 13:34 MetaIS.2.bed

### bed files for each Index-Set
ls -ltrh snapshot_test_run_merge_IndexSets_bed_files | head
total 9408
-rw-r--r--  1 universe    73K Feb  3 13:34 1.0_0_0_0_0_0_0_0_0_0_0_0_1.index_set.bed
-rw-r--r--  1 universe   137K Feb  3 13:34 2.0_0_0_0_0_0_0_0_0_0_0_1_0.index_set.bed
-rw-r--r--  1 universe   152K Feb  3 13:34 3.0_0_0_0_0_0_0_0_0_0_0_1_1.index_set.bed
-rw-r--r--  1 universe    67K Feb  3 13:34 4.0_0_0_0_0_0_0_0_0_0_1_0_0.index_set.bed
-rw-r--r--  1 universe    86K Feb  3 13:34 5.0_0_0_0_0_0_0_0_0_0_1_0_1.index_set.bed
-rw-r--r--  1 universe    87K Feb  3 13:34 6.0_0_0_0_0_0_0_0_0_0_1_1_1.index_set.bed
-rw-r--r--  1 universe   242K Feb  3 13:34 7.0_0_0_0_0_0_0_0_0_1_0_0_0.index_set.bed
-rw-r--r--  1 universe    47K Feb  3 13:34 8.0_0_0_0_0_0_0_0_0_1_0_0_1.index_set.bed
-rw-r--r--  1 universe    43K Feb  3 13:34 9.0_0_0_0_0_0_0_0_0_1_0_1_0.index_set.bed


