


A simple line and area charting library for iOS.
📈 Line and area charts 🌞 Multiple series 🌒 Partially filled series 🏊 Works with signed Double 🖖 Touch events


Table of Content
SwiftChart is available through CocoaPods. To install it, simply add the following line to your Podfile:
pod "SwiftChart"- Download SwiftChart.zip from the last release and extract its content in your project's folder.
- From the Xcode project, choose Add Files to ... from the File menu and add the extracted files.
The library includes:
- the Chart main class, to initialize and configure the chart’s content, e.g. for adding series or setting up the its appearance
- the ChartSeries class, for creating datasets and configure their appearance
- the ChartDelegate protocol, which tells other objects about the chart’s touch events
- the ChartColor struct, containing some predefined colors
Example
let chart = Chart()
let series = ChartSeries([0, 6, 2, 8, 4, 7, 3, 10, 8])
series.color = ChartColors.greenColor()
chart.add(series)
To run the example project, clone the repo, and run pod install from the Example directory first.
The chart can be initialized from the Interface Builder. Drag a normal View into a View Controller and assign to it the Chart Custom Class from the Identity Inspector.
To initialize a chart programmatically, use the Chart(frame: ...) initializer, which requires a frame:
let chart = Chart(frame: CGRect(x: 0, y: 0, width: 200, height: 100))If you prefer to use Autolayout, set the frame to 0 and add the constraints later:
let chart = Chart(frame: CGRectZero)
// add constraints nowInitialize each series before adding them to the chart. To do so, pass an array to initialize a ChartSeries object:
let chart = Chart(frame: CGRect(x: 0, y: 0, width: 200, height: 100))
let series = ChartSeries([0, 6.5, 2, 8, 4.1, 7, -3.1, 10, 8])
chart.add(series)
Result:
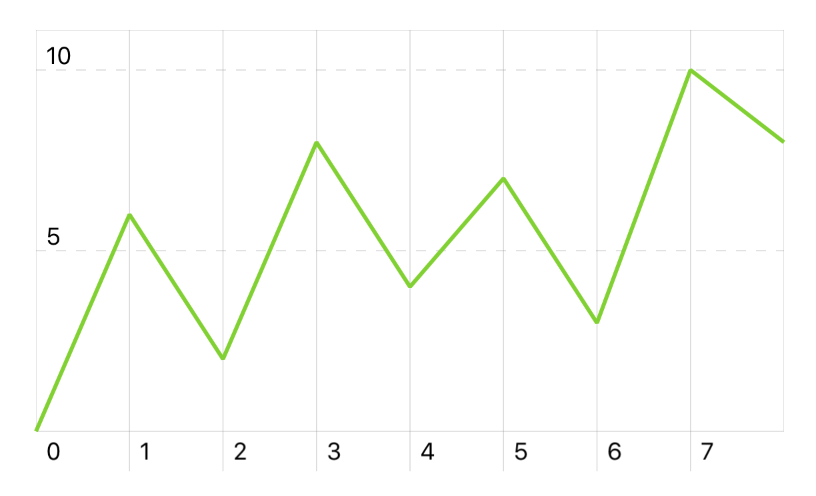
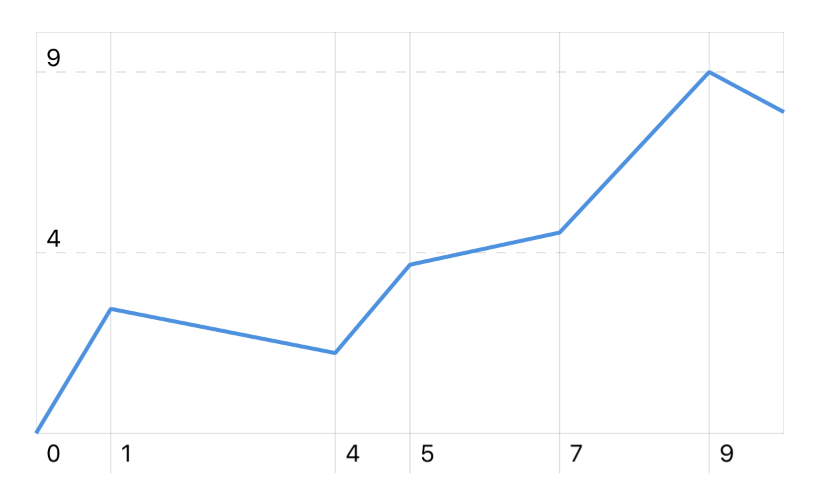
As you can see, as default the values on the x-axis are the progressive indexes of the passed array. You can customize those values by passing an array of (x: Double, y: Double) tuples to the series initializer:
let chart = Chart(frame: CGRect(x: 0, y: 0, width: 200, height: 100))
// Create a new series specifying x and y values
let data = [
  (x: 0, y: 0),
  (x: 1, y: 3.1),
  (x: 4, y: 2),
  (x: 5, y: 4.2),
  (x: 7, y: 5),
  (x: 9, y: 9),
  (x: 10, y: 8)
]
let series = ChartSeries(data: data)
chart.add(series)
Result:
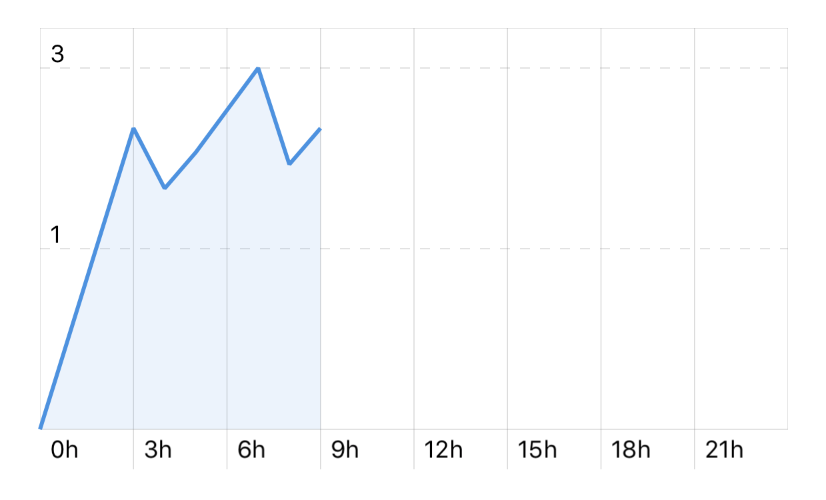
Use the chart.xLabels property to make the x-axis showing more labels than those inferred from the actual data. For example,
let chart = Chart(frame: CGRect(x: 0, y: 0, width: 200, height: 100))
let data = [
  (x: 0, y: 0),
  (x: 3, y: 2.5),
  (x: 4, y: 2),
  (x: 5, y: 2.3),
  (x: 7, y: 3),
  (x: 8, y: 2.2),
  (x: 9, y: 2.5)
]
let series = ChartSeries(data: data)
series.area = true

// Use `xLabels` to add more labels, even if empty
chart.xLabels = [0, 3, 6, 9, 12, 15, 18, 21, 24]

// Format the labels with a unit
chart.xLabelsFormatter = { String(Int(round($1))) + "h" }

chart.add(series)
Result:
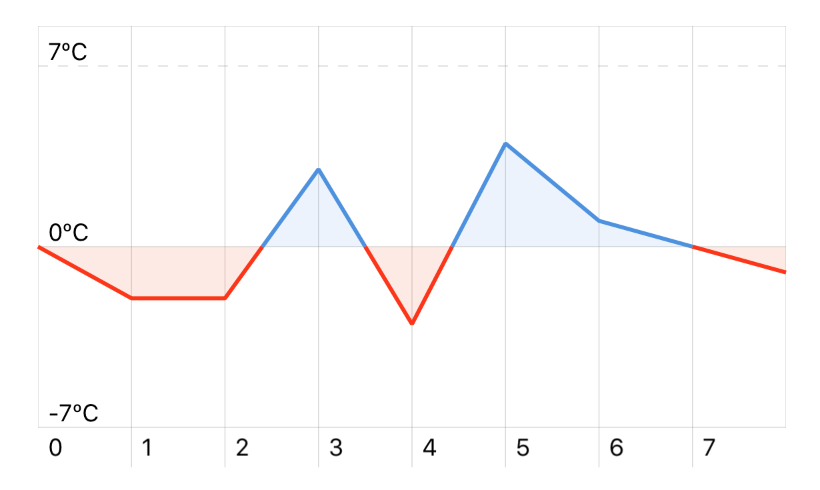
The chart displays the series in different colors when below or above the zero-axis:
let chart = Chart(frame: CGRect(x: 0, y: 0, width: 200, height: 100))
let data: [Double] = [0, -2, -2, 3, -3, 4, 1, 0, -1]

let series = ChartSeries(data)
series.area = true

chart.add(series)

// Set minimum and maximum values for y-axis
chart.minY = -7
chart.maxY = 7

// Format y-axis, e.g. with units
chart.yLabelsFormatter = { String(Int($1)) +  "ºC" }
Result:
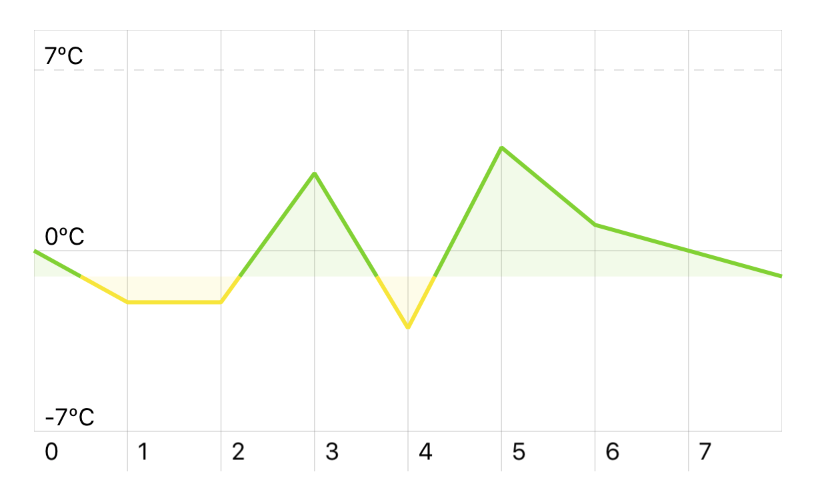
You can customize the zero-axis and the colors with the colors options in the ChartSeries class.
series.colors = (
  above: ChartColors.greenColor(),
  below: ChartColors.yellowColor(),
  zeroLevel: -1
)
Result:
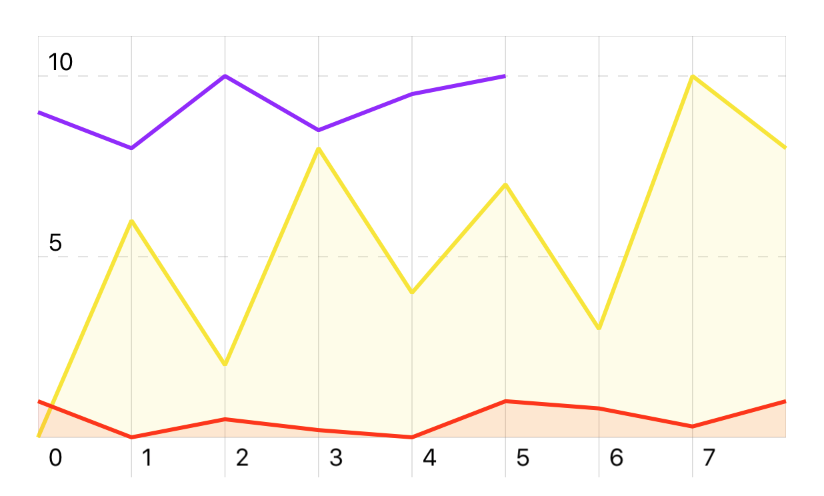
Using the chart.add(series: ChartSeries) and chart.add(series: Array<ChartSeries>) methods you can add more series. Those will be indentified with a progressive index in the chart’s series property.
let chart = Chart(frame: CGRect(x: 0, y: 0, width: 200, height: 100))

let series1 = ChartSeries([0, 6, 2, 8, 4, 7, 3, 10, 8])
series1.color = ChartColors.yellowColor()
series1.area = true

let series2 = ChartSeries([1, 0, 0.5, 0.2, 0, 1, 0.8, 0.3, 1])
series2.color = ChartColors.redColor()
series2.area = true

// A partially filled series
let series3 = ChartSeries([9, 8, 10, 8.5, 9.5, 10])
series3.color = ChartColors.purpleColor()

chart.add([series1, series2, series3])
Result:
To make the chart respond to touch events, implement the ChartDelegate protocol in your class, e.g. a View Controller, and then set the chart’s delegate property:
class MyViewController: UIViewController, ChartDelegate {
  override func viewDidLoad() {
    let chart = Chart(frame: CGRect(x: 0, y: 0, width: 100, height: 200))
    chart.delegate = self
  }

  // Chart delegate
  func didTouchChart(chart: Chart, indexes: Array<Int?>, x: Double, left: CGFloat) {
    // Do something on touch
  }

  func didFinishTouchingChart(chart: Chart) {
    // Do something when finished
  }

  func didEndTouchingChart(chart: Chart) {
    // Do something when ending touching chart
  }
}
The didTouchChart method passes an array of indexes, one for each series, with an optional Int referring to the data’s index:
 func didTouchChart(chart: Chart, indexes: Array<Int?>, x: Double, left: CGFloat) {
    for (seriesIndex, dataIndex) in enumerate(indexes) {
      if dataIndex != nil {
        // The series at `seriesIndex` is that which has been touched
        let value = chart.valueForSeries(seriesIndex, atIndex: dataIndex)
      }
    }
  }
You can use chart.valueForSeries() to access the value for the touched position.
The x: Double argument refers to the value on the x-axis: it is inferred from the horizontal position of the touch event, and may be not part of the series values.
The left: CGFloat is the x position on the chart’s view, starting from the left side. It may be used to set the position for a label moving above the chart:
Use the Chart class to initialize and configure the chart’s content, e.g. for adding series or setting up the its appearance.
Example
let chart = Chart(frame: CGRect(x: 0, y: 0, width: 200, height: 100))| Option name | Type | Description |
|---|---|---|
areaAlphaComponent |
CGFloat |
Alpha factor for the areas colors (default 0.1) |
axesColor |
UIColor |
The color of the axes (default .gray) |
bottomInset |
CGFloat |
Height of the area at the bottom of the chart, containing the labels for the x-axis (default 20) |
delegate |
ChartDelegate |
The delegate to listen to touch events |
highlightLineColor |
UIColor |
The color of the highlight line (default gray) |
highlightLineWidth |
CGFloat |
The width of the highlight line (default 0.5) |
hideHighlightLineOnTouchEnd |
Bool |
Hide the highlight line when the touch event ends, e.g. when stop swiping over the chart (default false) |
gridColor |
UIColor |
The color of the grid (default .gray) |
labelColor |
UIColor |
The color of the labels (default .black) |
labelFont |
UIFont? |
The font used for the labels |
lineWidth |
CGFloat |
The width of the chart's lines (default 2) |
maxX |
Double? |
A custom maximum x-value |
maxY |
Double? |
A custom maximum y-value |
minX |
Double? |
A custom minimum x-value |
minY |
Double? |
A custom minimum y-value |
topInset |
CGFloat |
Height of the area at the top of the chart, acting a padding to make place for the top y-axis label (default 20) |
xLabelsFormatter |
(Int, Double) -> String |
Function to format the labels on the x-axis |
xLabelsOrientation |
ChartLabelOrientation |
Sets the x-axis labels orientation to vertical or horizontal (default .horizontal) |
xLabelsTextAlignment |
NSTextAlignment |
Alignment for the text in the x-labels (default .left) |
xLabelsSkipLast |
Bool |
Skip the last x-label. Setting this to false will make the label overflow the frame width, so use carefully (default true) |
yLabelsFormatter |
(Int, Double) -> String |
Function to format the labels on the y-axis |
yLabelsOnRightSide |
Bool |
Place the y-labels on the right side (default false) |
| Method Name | Signature | Description |
|---|---|---|
add |
(_ series: ChartSeries) |
Add a series to the chart |
add |
(_ series: [ChartSeries]) |
Add multiple series to the chart |
removeSeriesAt |
(_ index: Int) |
Remove the series at the specified index. |
removeAllSeries |
Remove all the series. | |
valueForSeries |
(_ seriesIndex: Int, atIndex dataIndex: Int?) -> Double? |
Returns the value for the specified series at the given index |
Use the ChartSeries class to create a chart series and configure its appearance or behavior.
Example
let data: [Double] = [0, -2, -2, 3, -3, 4, 1, 0, -1]
let series = ChartSeries(data)| Option name | Type | Description |
|---|---|---|
area |
Bool |
Draws an area below the series line (default false) |
line |
Bool |
When set to false, will hide the series line. Useful for drawing only the area with area=true (default true) |
color |
UIColor |
The series color. You can use the ChartColors struct for some colors shortcuts. (default .blueColor()) |
colors |
(above: UIColor, below: UIColor, zeroLevel: Double) |
A tuple to specify the color above or below the zero (or the value specified by zeroLevel). |
Use the ChartDelegate protocol to tell other objects about the chart’s touch events.
| Method | Description |
|---|---|
didTouchChart |
Tells the delegate that the specified chart has been touched |
didFinishTouchingChart |
Tells the delegate that the user finished touching the chart. The user will "finish" touching the chart only swiping left/right outside the chart. |
didEndTouchingChart |
Tells the delegate that the user ended touching the chart. The user will "end" touching the chart whenever the touchesDidEnd method is being called. |
If you have issue with this library, please tag your question with swiftchart on Stack Overflow.
The Chart class inherits from UIView, so if your chart is not displaying it is likely a problem related to the view's size. Check your view constraints and make sure you initialize it on viewDidLoad, when UIKit can calculate the view dimensions.
Some tips for debugging an hidden chart:
- start your app and then debug the UI Hierarchy from the Debug navigator
- initialize a simple UIView with a colored background instead of the chart to easily see how the view is positioned
- try to not to nest the chart in a subview for better debugging
SwiftChart is available under the MIT license. See the LICENSE file for more info.