Dashboard ideas for static model QC/validation #801
Description
QC of raw well logs vs upscaled well logs
- Visual inspection of which raw log values are upscaled into grid cells is required QC in the static geomodel.
- Currently this is done by navigating through each well in a blocked well viewer.
 )
)
 )
)
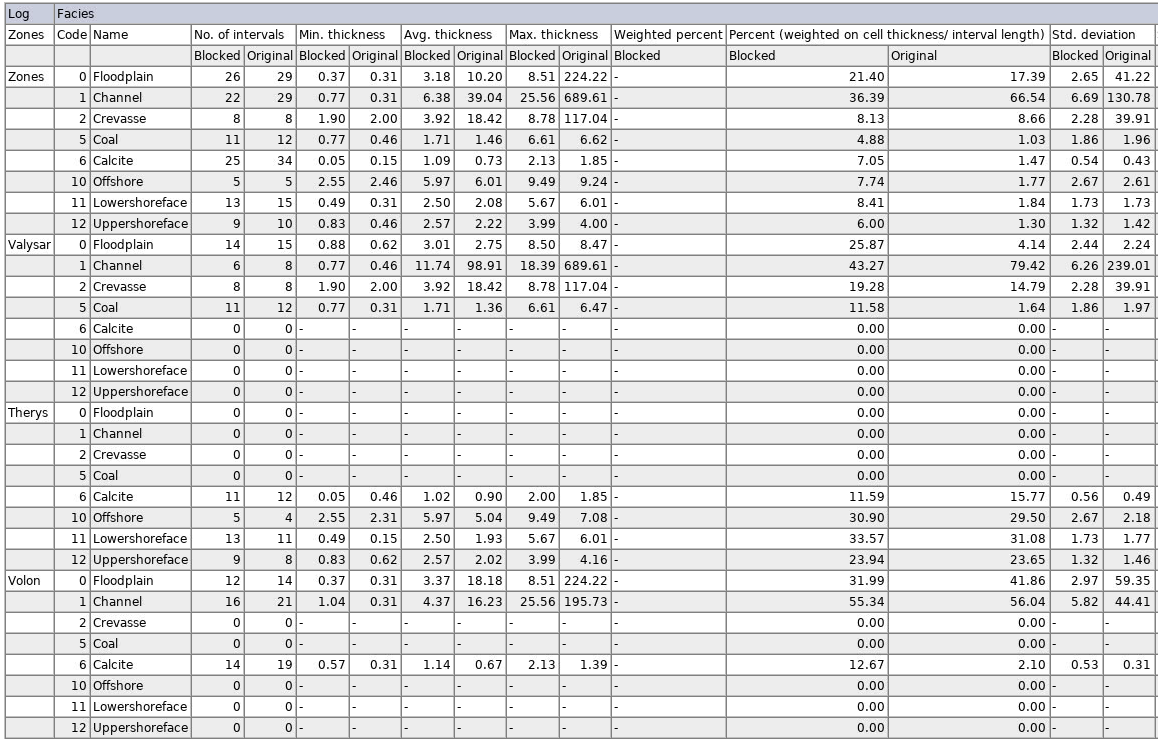
- Should have a tab for facies thickness statistics (min/max/avg/) and facies fraction percentage per zone and facies.
 )
)
Investigate options of simplifying this QC.
Challenges:
- How to visualize?
- Can we extract necessary data, i.e. which raw log values goes into which cells.
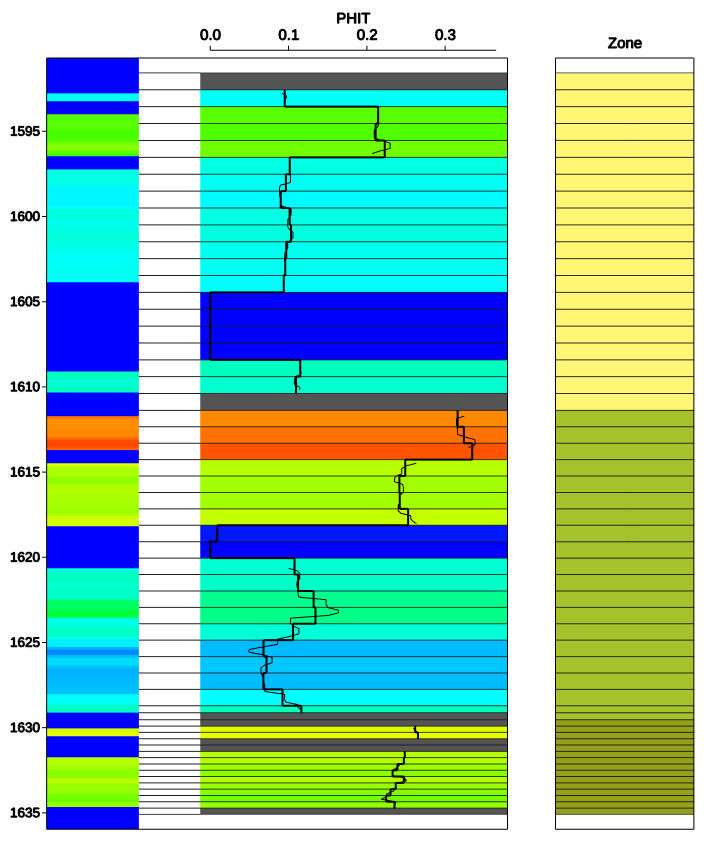
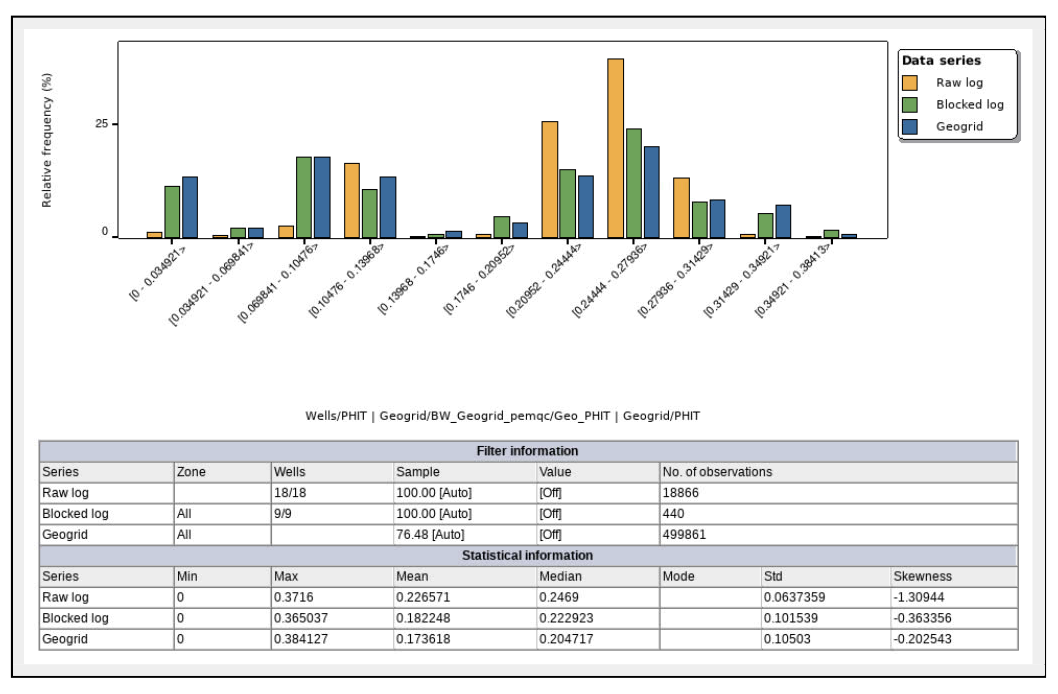
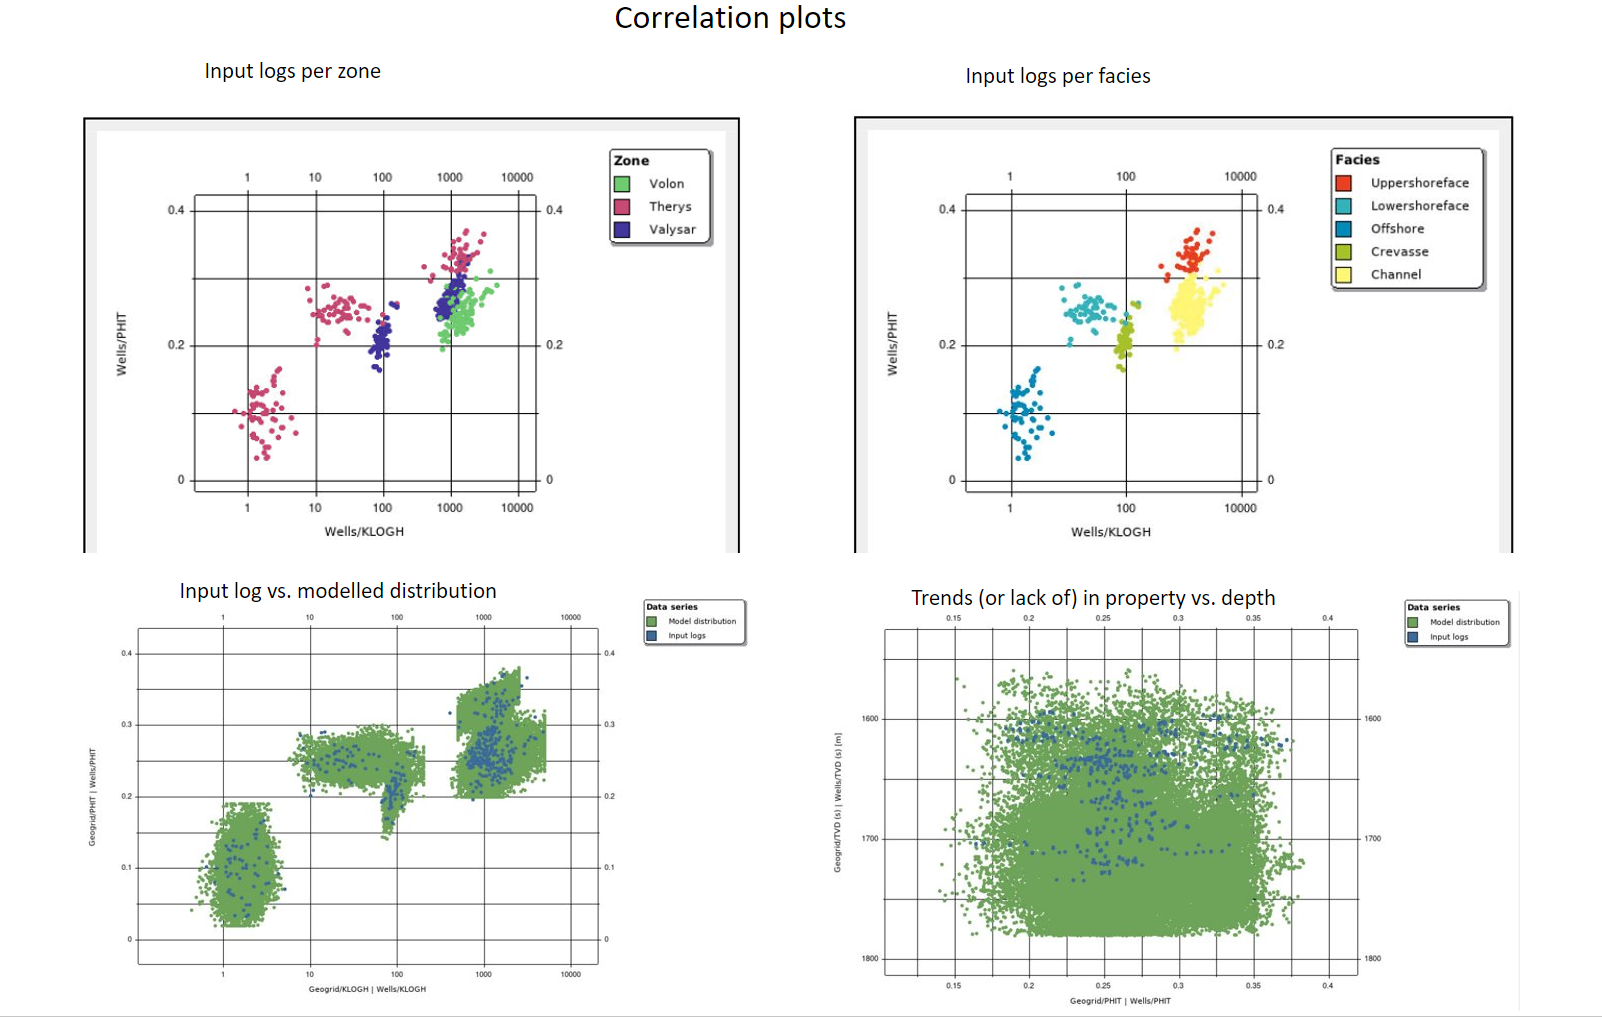
QC of input logs vs modelled distribution
Verifying correct property distribution in input logs vs. modelled parameter is a tedious process today. Requiring a lot of manual clicking to filter on e.g. zones and regions.
A tailored dashboard for this purpose would save a lot of time.
- Verify that property distribution is preserved in the model compared with the input data.
- Compare raw logs, vs blocked logs vs modelled parameter
- The modelled parameter should be statistics from the ensemble
- Easily filter on e.g. zone / zonelog.
- Group wells per region (e.g. by extracting region information as a log)
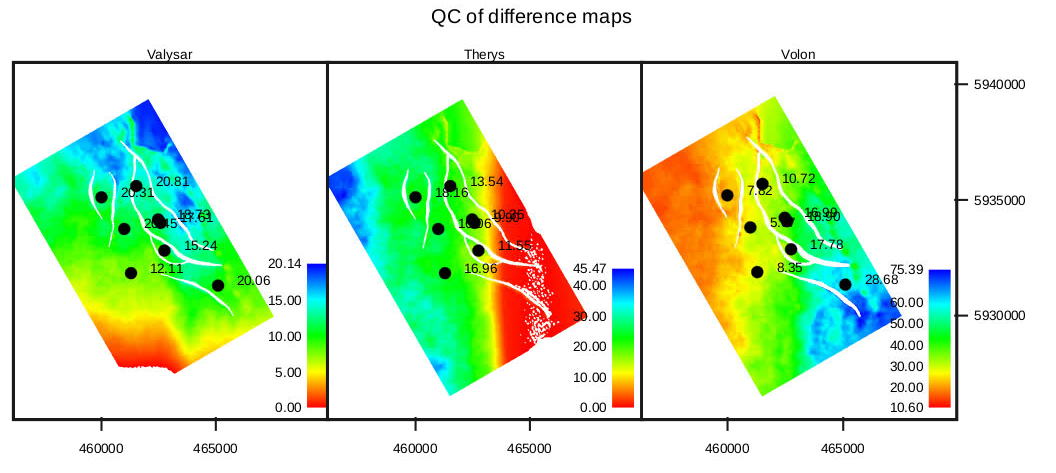
QC of difference maps
- Difference maps between isochores in different revisions
- Difference maps between input seismic interpreted surfaces and surfaces used as input to the geological grid
Example of isochore maps with input thickness point
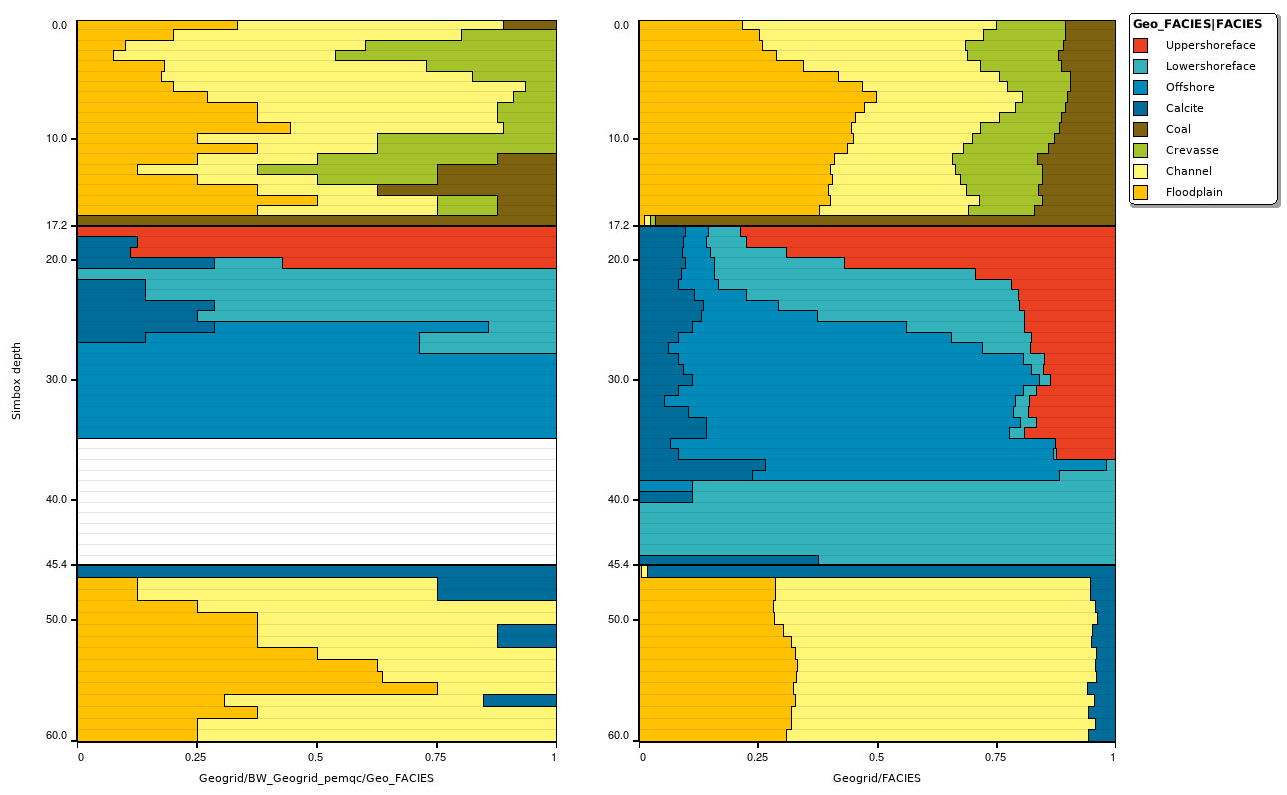
QC of facies vertical proportions
- QC display of vertical facies trend in blocked well vs modelled parameter