IoT scenarios often face challenges like a large number of devices, high data generation rates, and the huge accumulated data volumes. Therefore, how to access, store, and process these massive amounts of data has become a critical issue.
EMQX, as a highly scalable, powerful and feature-rich MQTT broker for the IoT, can handle billions of concurrent connections and millions of messages per second in a single cluster. Furthermore, its built-in Data Integration functionality provides an out-of-the-box solution, which enables seamless integrating IoT data with more than 40 cloud services and enterprise systems, including Kafka, SQL, NoSQL, and time-series databases.
This blog series presents the benchmark test results of the integrations against a single node EMQX server.
In this post, we provide the benchmarking result of PostgreSQL integration - a single node EMQX processes and inserts 100,000 QoS1 messages per second to PostgreSQL.
This benchmark testing simulates 100,000 MQTT clients connecting to EMQX, with a connection rate of 5,000 per second. After all connections are established, each client publishes one QoS 1 message with the payload of 200 bytes per second, and all messages, via the rule engine, are written into PostgreSQL.
- Concurrent connections: 100,000
- Topics: 100,000
- CPS (new established connections per sec.): 5000
- QoS: 1
- Keep alive: 300s
- Payload: 200 bytes
- Message publish TPS: 100,000/second
The test environment is configured on Alibaba Cloud, and all virtual machines are within a VPC (virtual private cloud) subnet.
| Service | Deployment | Version | OS | CPU | Memory | Cloud Host model |
|---|---|---|---|---|---|---|
| EMQX | single node | 5.1.0 | Centos 7.8 | 32C | 64G | c6.8xlarge |
| PostgreSQL | standalone | 13.5 | Centos 7.8 | 16C | 64G | c6.4xlarge |
XMeter is used in this benchmark test to simulate MQTT clients. XMeter is built on top of JMeter but with enhanced scalability and more capabilities. It provides comprehensive and real-time test reports during the test. Additionally, its built-in monitoring tools are used to track the resource usage of the EMQX and PostgreSQL machines.
XMeter provides a private deployment version (on-premise) and a public cloud SaaS version. A private XMeter is deployed in the same VPC as the EMQX and PostgreSQL in this testing.
For the detailed steps of configuring EMQX-PostgreSQL integration, please refer to EMQX Doc. The 3 figures below are PostgreSQL Bridge settings used in this benchmark testing.
Please refer to EMQX Doc for the Linux Kernel tuning.
- the usage of CPU and memory keeps stable
- the average of CPU user: 76%
- Memory used: Max 14GB, stabilized at around 11G.
- the average of response time of publish: 2.95ms
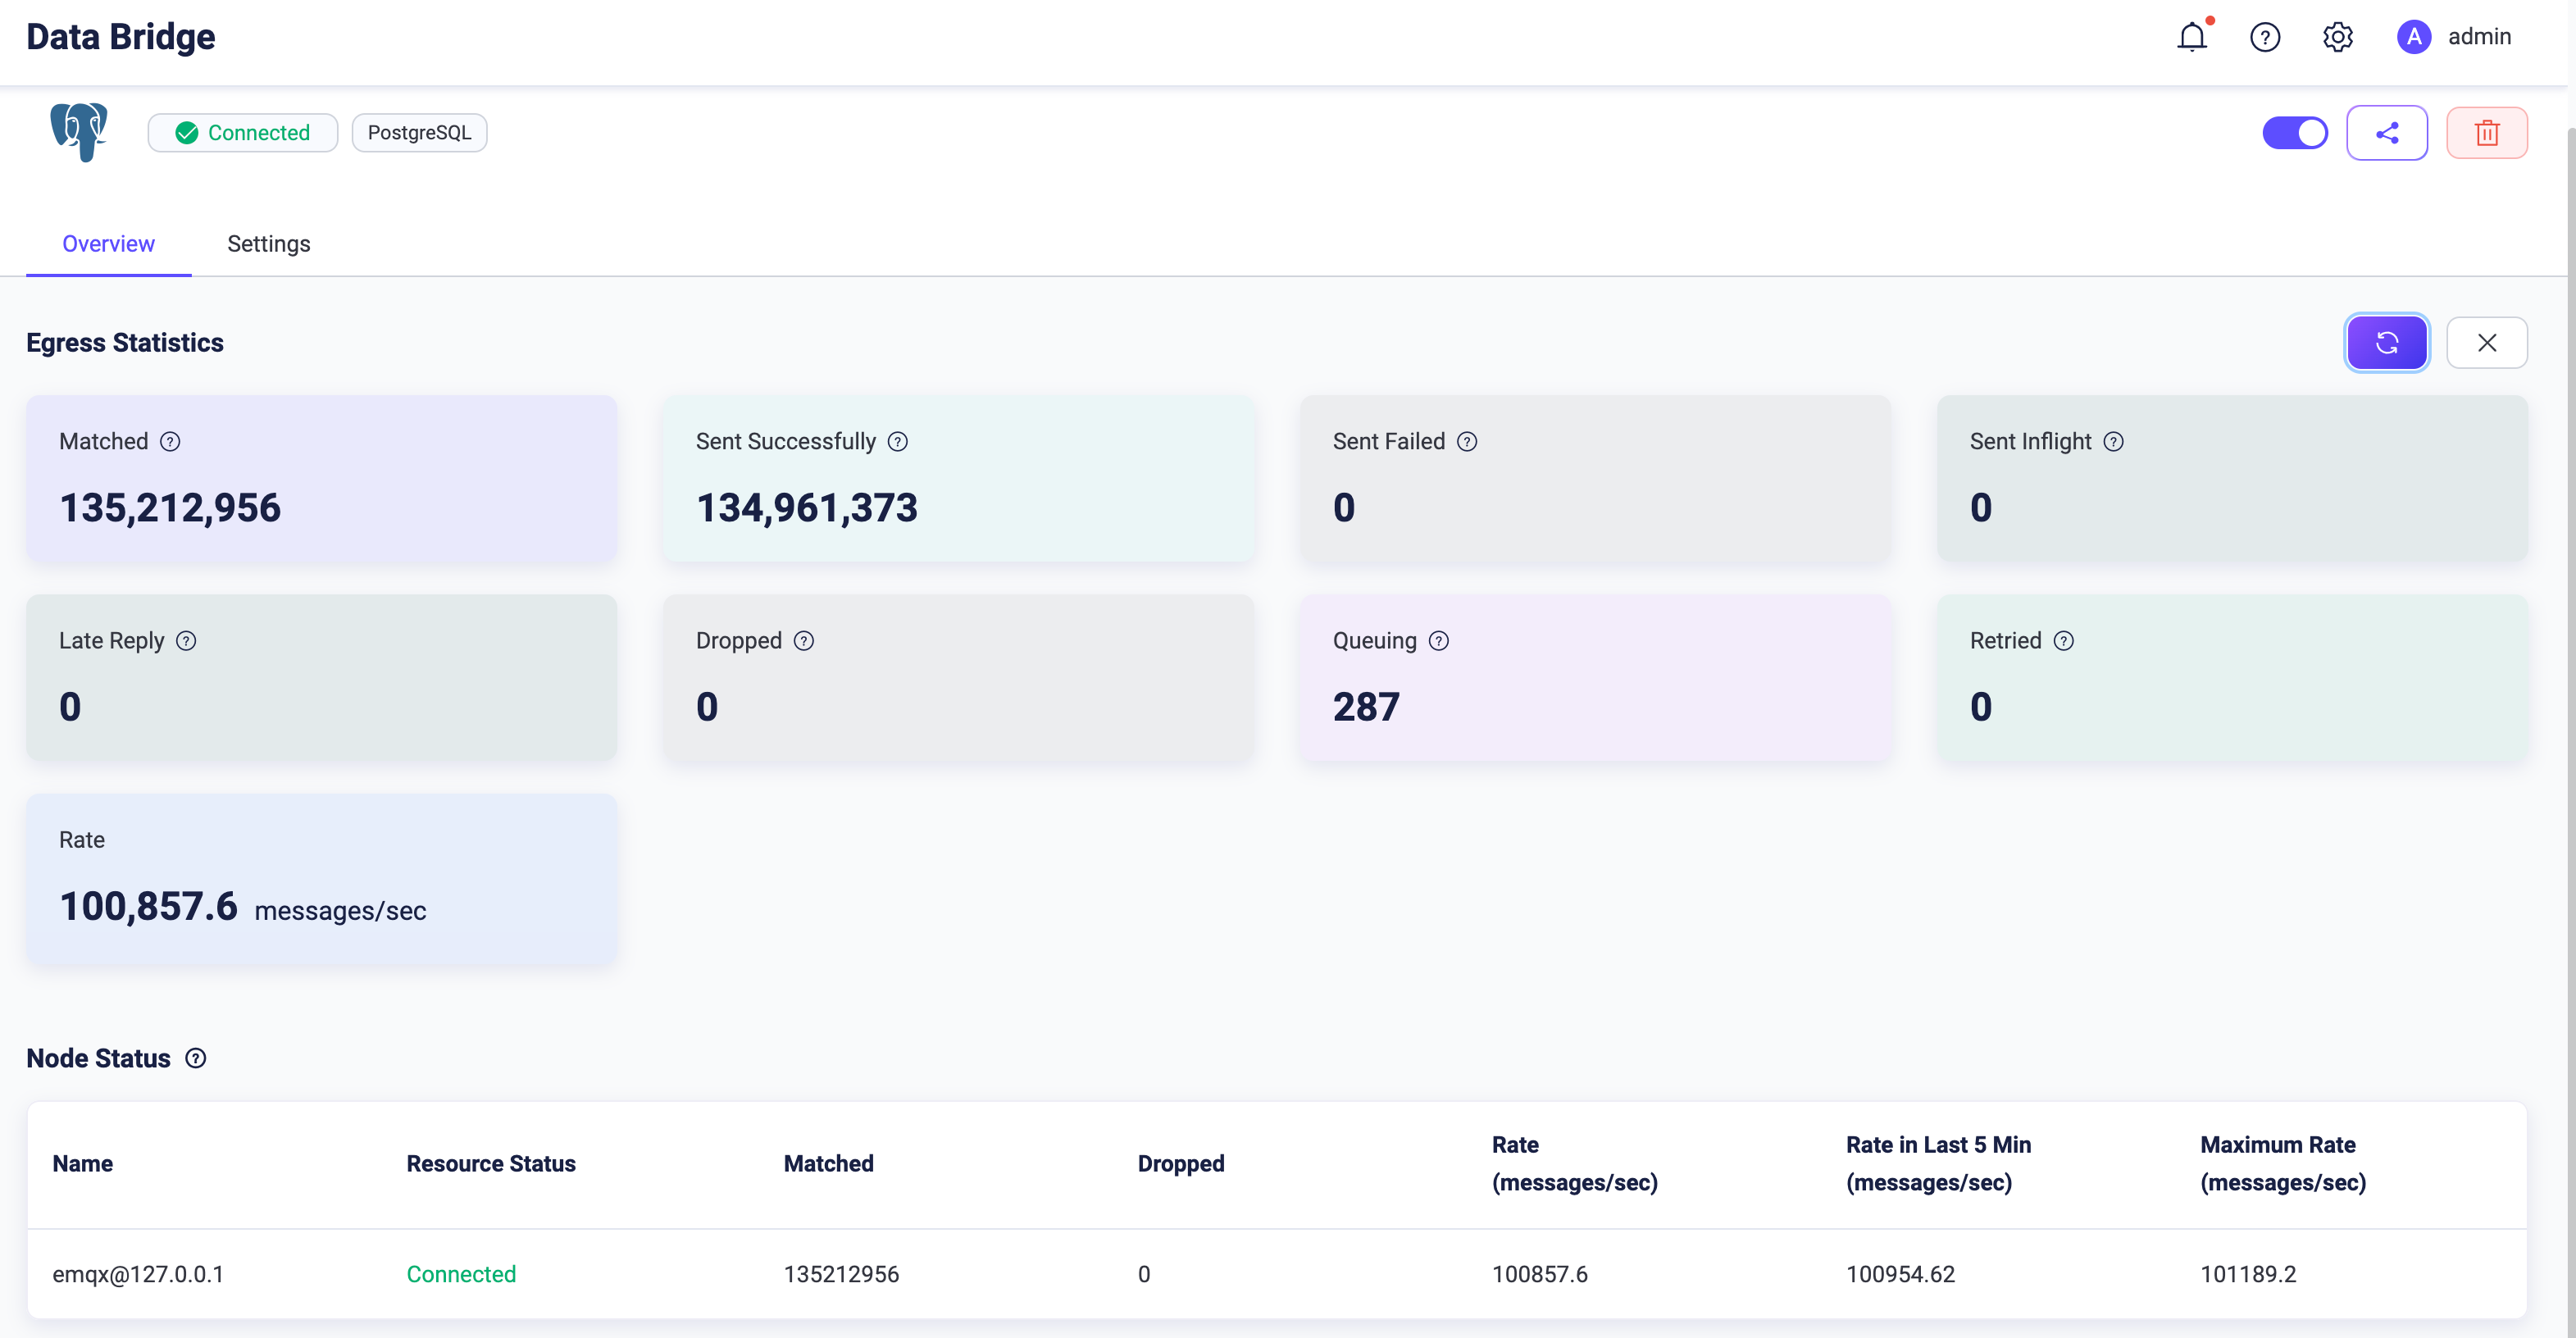
- After the test was completed, by comparing the data statistics from the EMQX Dashboard Data Bridge Statistics with the number of queries in the corresponding table of the database, it was observed that all messages were written to PostgreSQL in real-time and successfully.
Screenshots of EMQX Dashboard & Rule Engine during the test
The above two screenshots show that both the incoming message rate & processing rate by Data Bridge are 100,000+ per second, and all messages hit by the rule are written to the database in real time.
Screenshots after the test completed
The above screenshots show that all messages EMQX received were forwarded to PostgreSQL successfully.
XMeter report chart
PostgreSQL is a powerful, open source object-relational database system with over 35 years of active development that has earned it a strong reputation for reliability, feature robustness, and performance. This benchmark report has showed the great performance of EMQX-PostgreSQL integration on single node deployment.
By easily configuring EMQX and PostgreSQL through a user-friendly interface, a robust and out-of-the-box IoT solution is ready for you.


