[RUM dashboard] visitor breakdown usability improvements #74838
Description
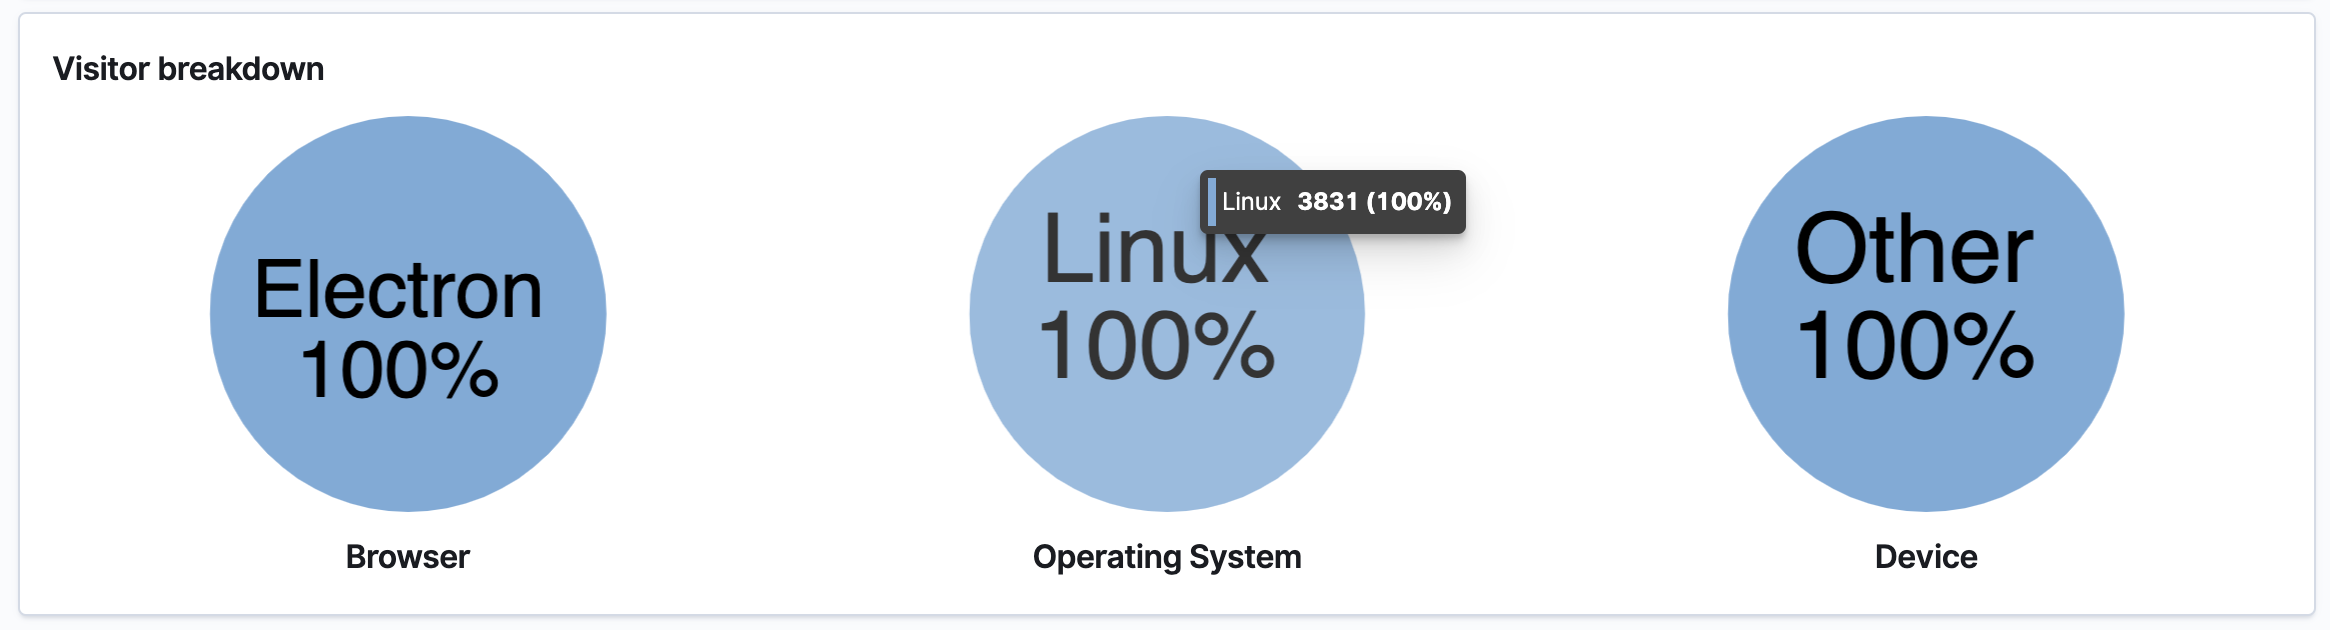
- Please add a legend to the pie charts
Please add a unit to the tooltip and explain what this number means (average/median...)[RUM Dashboard] Visitor breakdown charts tooltip #76953- Change label to
Operating system - Change the order of the slices to
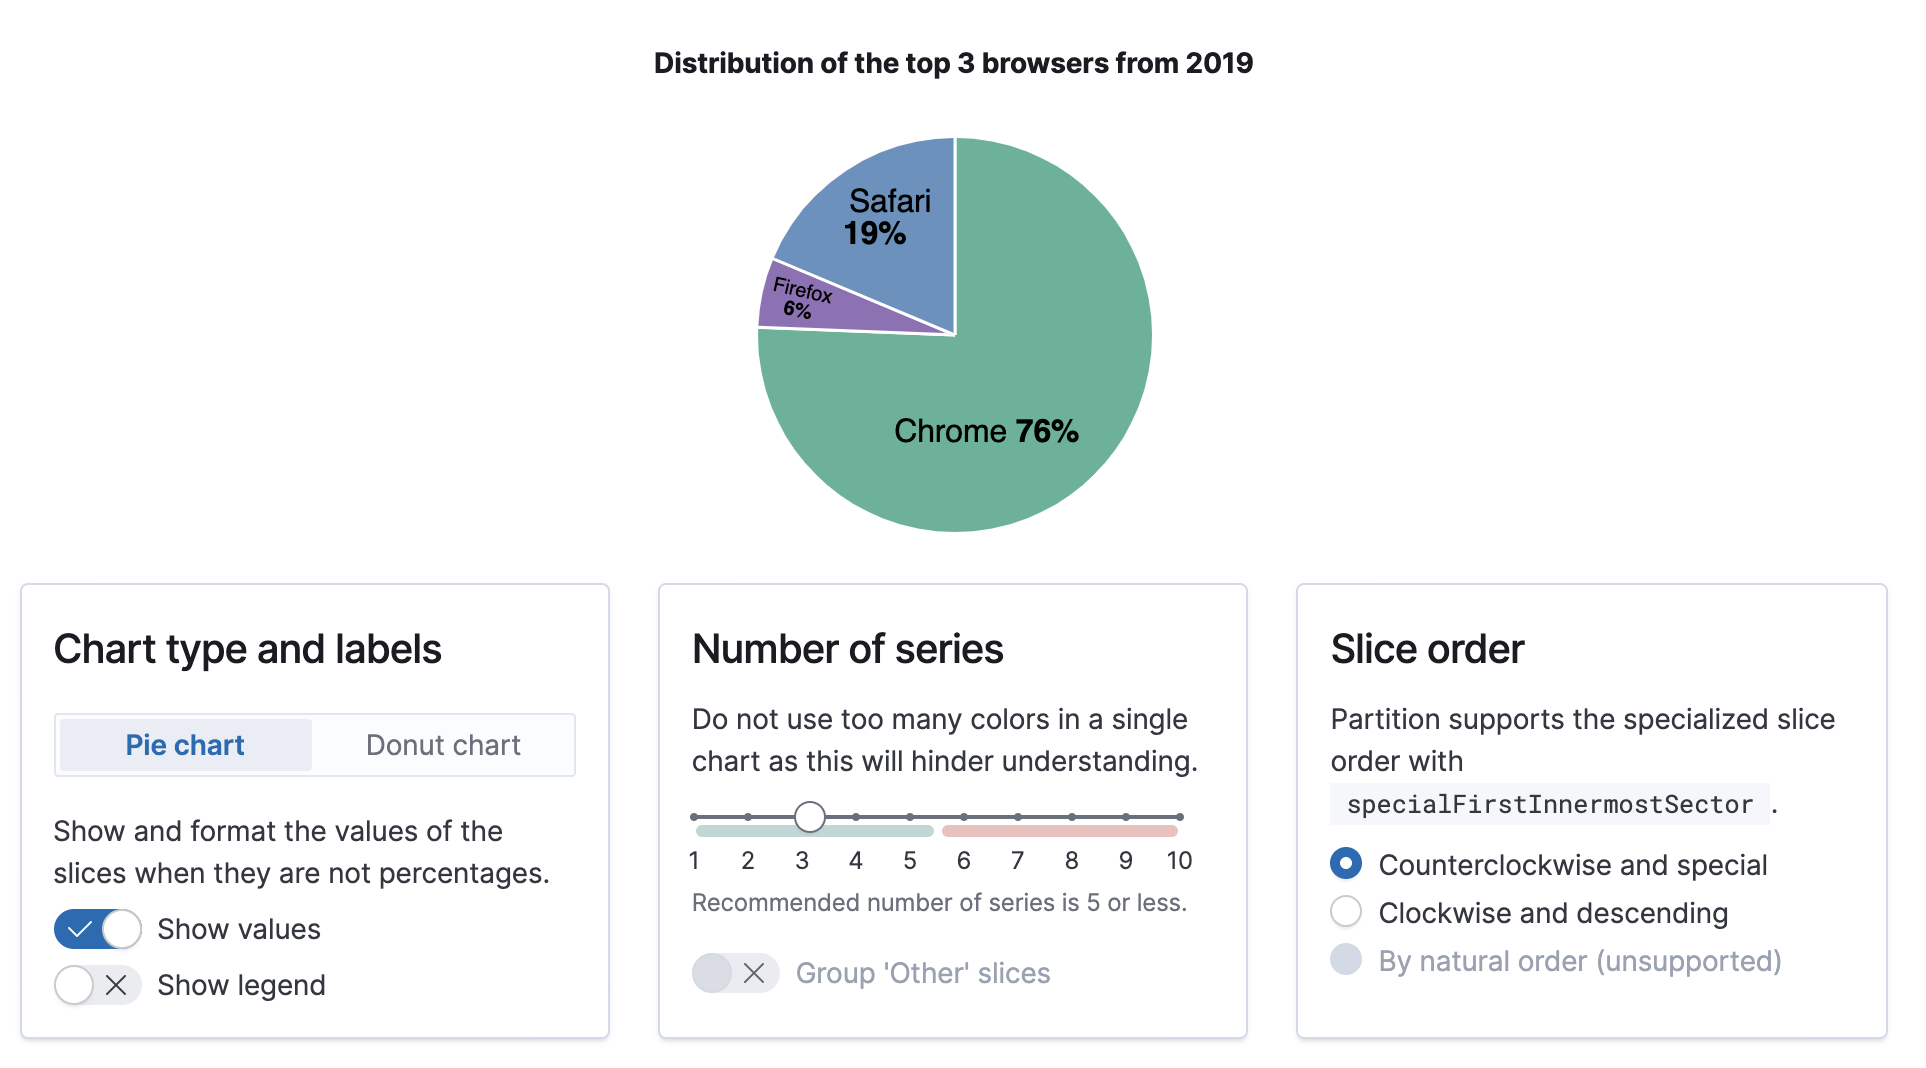
clockwiseSectors: falseto sort them categorically, as explained in the EUI chart guidelines (excerpt below)
The order of the slices should always start from the 12 o’clock position, showing the largest slice in the clockwise position then the rest ordering counterclockwise in descending order. However, categories that have a natural order, should follow this natural order, be it low to high or good to bad.
Screenshots from dev-next-oblt