Selecting optimize for printing exports pdf graphs with the X-axis labels moved into the chart #72314
Description
Kibana version:
7.7.1
Elasticsearch version:
7.7.1
Server OS version:
macOS
Browser:
Chrome
Version 83.0.4103.116 (Official Build) (64-bit)
Original install method (e.g. download page, yum, from source, etc.):
from source
Describe the bug:
Creating a pdf report of a dashboard using the 'optimize for printing', the x-axis labels on graphs move into the graph panel. The scroll bar also fires its rendered event early.
Steps to reproduce:
- run kibana version 7.7.1
- load the eCommerce sample dataset
- open the dashboard
- select Share -> PDF Reports -> Optimize for printing -> Generate PDF
- repeat step 4 without the Optimize for printing option: Share -> PDF Reports -> Generate PDF
- wait for the reports to generate
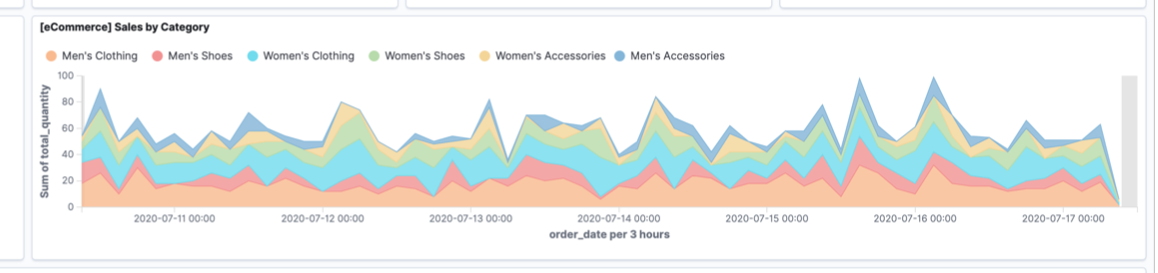
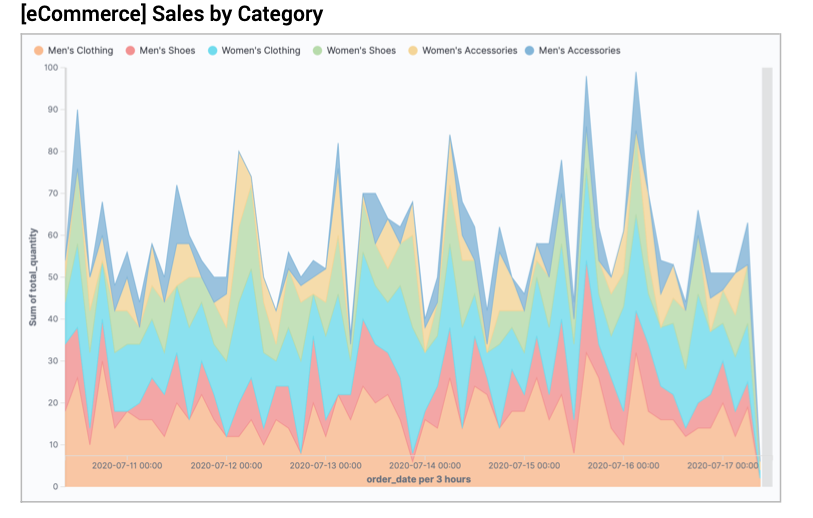
- open the reports and observe that the x-axis label for [eCommerce] Sales by Category has moved into the visualization panel for the optimized for printing report
Expected behavior:
The x-axis should remain below the visualization layer in PDF reports generated when Optimize for printing is selected.
Screenshots (if relevant):
Not optimized for printing:
Optimized for printing:
Errors in browser console (if relevant):
Non
Provide logs and/or server output (if relevant):
No errors or warnings logged
Any additional context:
The reporting team looked into the issue and noticed that the scroll bar seems to be firing its "rendered" event early. I wasn't able to track the early rendering in my local setup.