[AWS] Migrate EC2 metrics dashboard to lenses #5626
Conversation
💚 Build Succeeded
Expand to view the summary
Build stats
Test stats 🧪
🤖 GitHub commentsExpand to view the GitHub comments
To re-run your PR in the CI, just comment with:
|
🌐 Coverage report
|
 drewdaemon
left a comment
drewdaemon
left a comment
There was a problem hiding this comment.
Hi @gpop63 ! Glad to see this!
How would you feel about the following changes?
- move the
EC2 CPU Utilizationvisualization to the right of the instance state pie chart and status check failed metric. Make theEC2 CPU Utilizationvis take up half the screen, with the others taking up 1/4 each. - transpose the bottom four visualizations such that
Network In Bytesis vertically aboveNetwork out bytesandDiskIO Read Bytesis aboveDisk IO Write Bytes. This should make comparisons between the members of each pair easier since they will be aligned along the same time axis.
|
Hi! We just realized that we haven't looked into this PR in a while. We're sorry! We're labeling this issue as |
|
From meeting
|
|
New layout:
|

|
Package aws - 1.40.8 containing this change is available at https://epr.elastic.co/search?package=aws |
* add lenses

* bump package version

* fix layout
What does this PR do?
Migrates visualizations to lenses and adds input control groups.
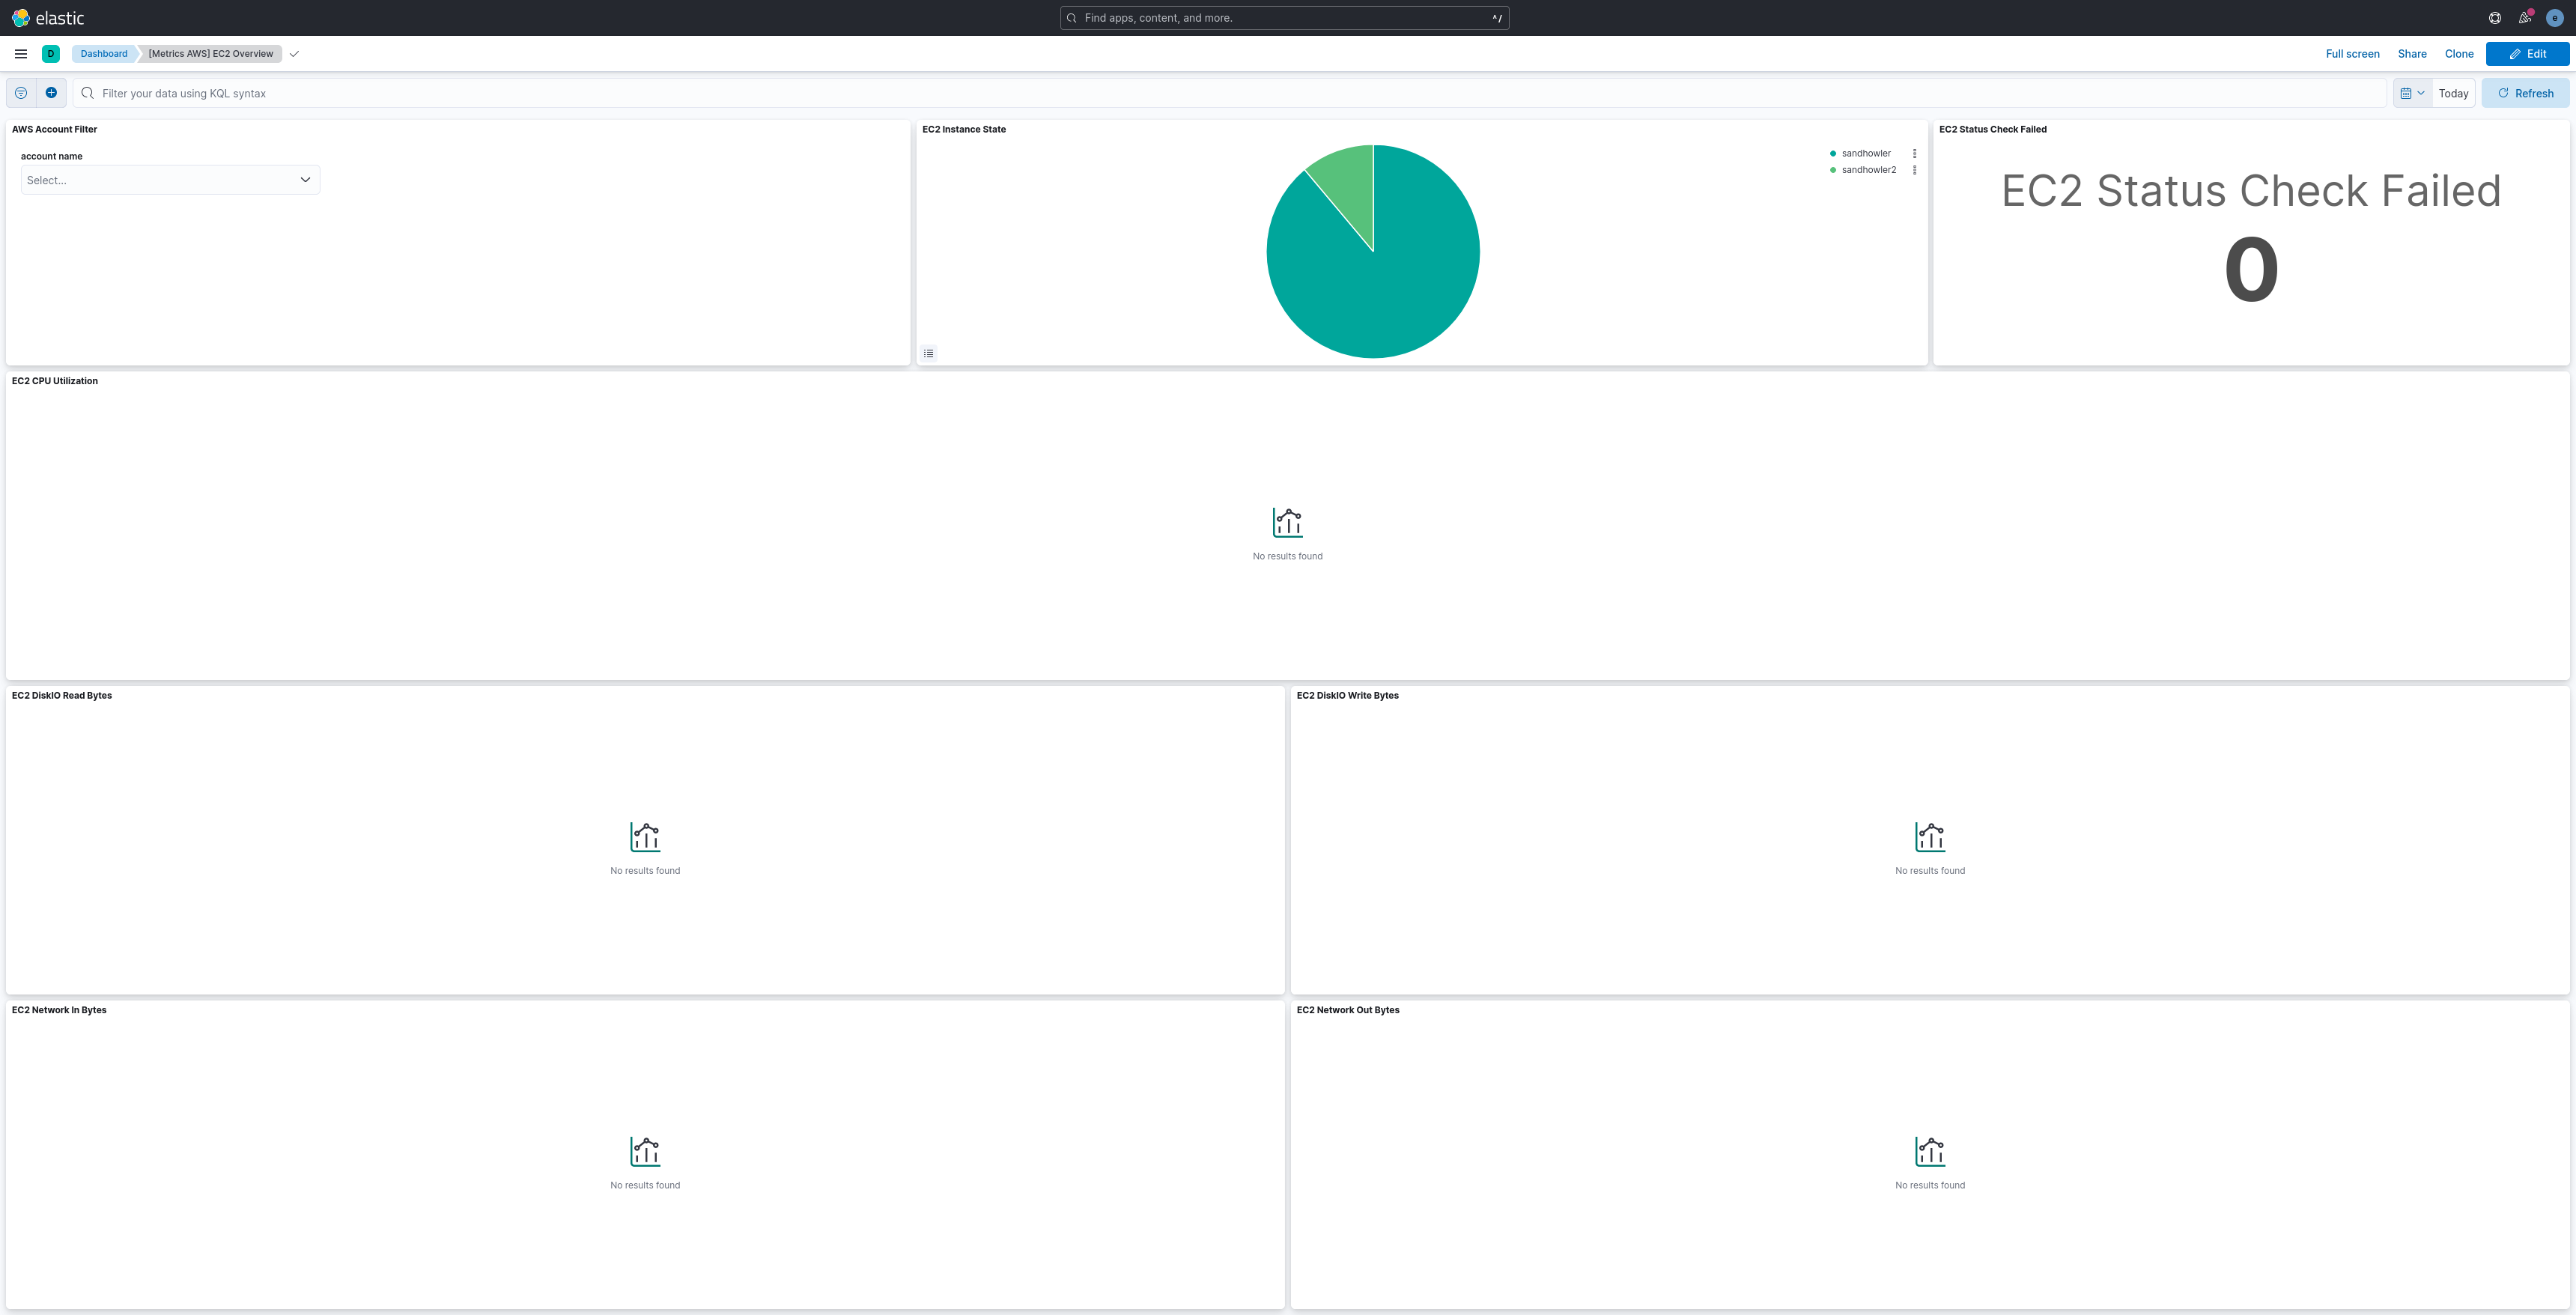
I used https://github.com/elastic/elastic-integration-corpus-generator-tool/ to generate random data stream data. For some reason old visualizations would not show the data in the dashboard so the before image would be empty panels.
Before:
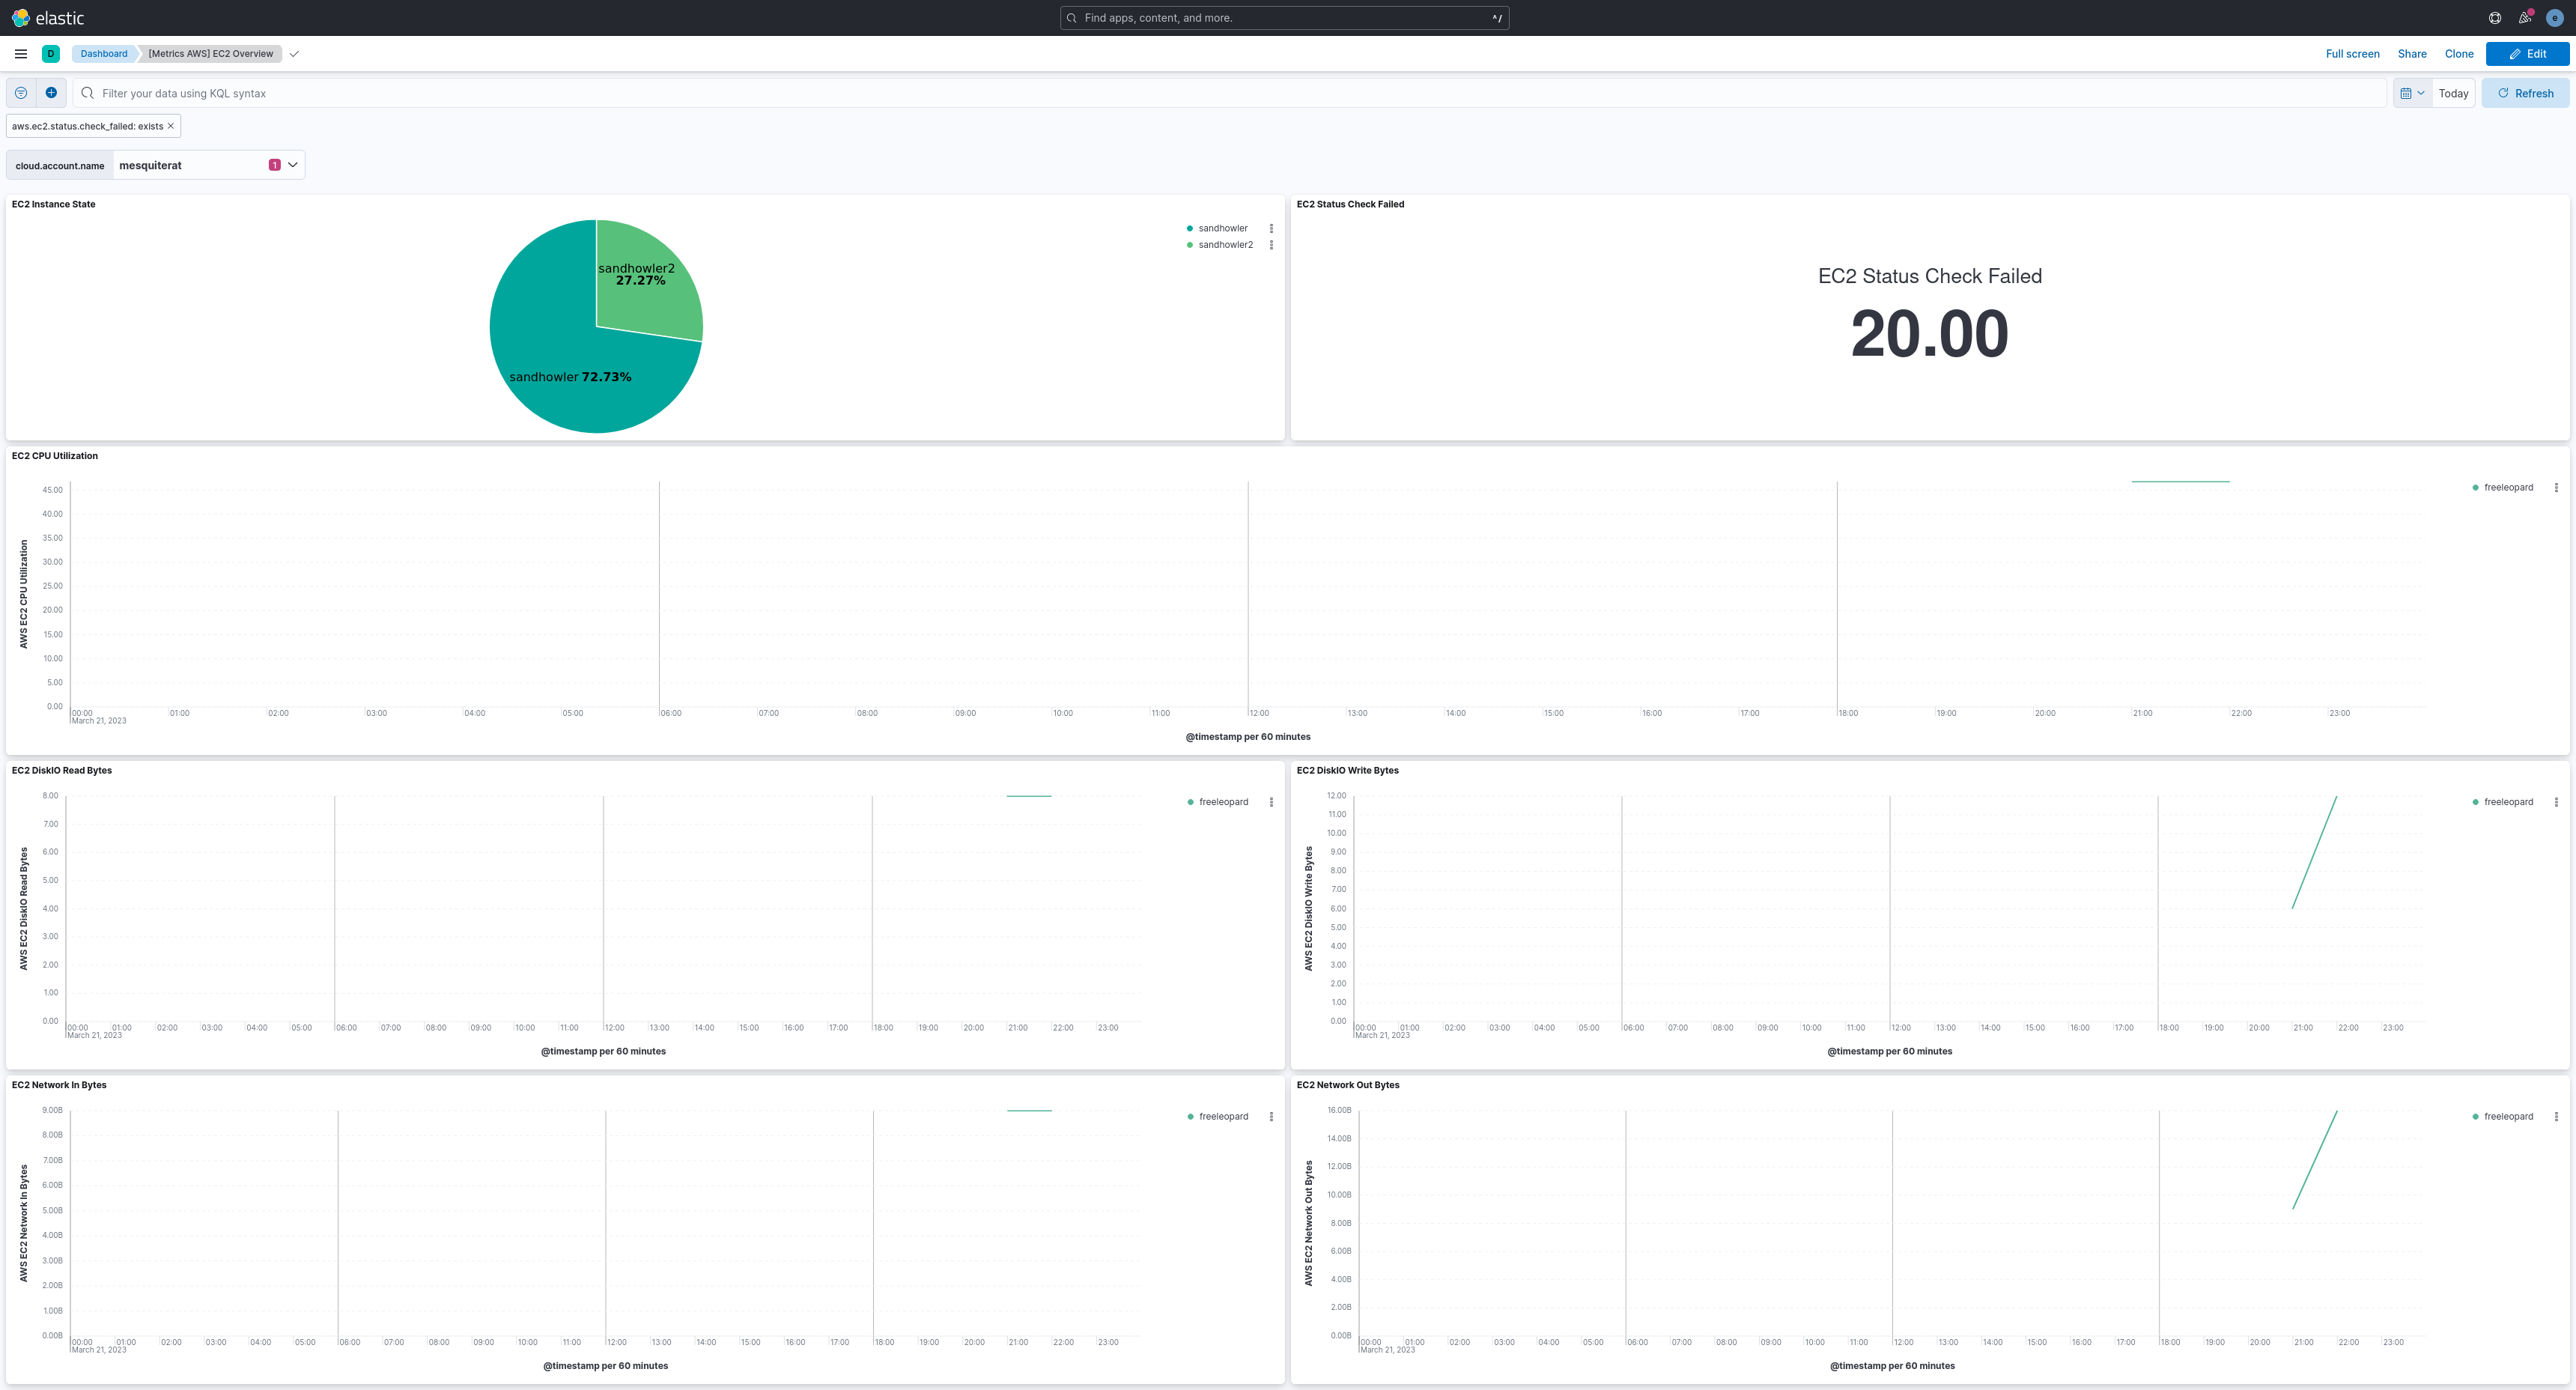
After:
Checklist
changelog.ymlfile.Author's Checklist
How to test this PR locally
Related issues
Screenshots