Skip to content

Diagram generator with hierarchical decomposition and views

License

Notifications You must be signed in to change notification settings

asherikov/hiearch

Folders and files

NameName
Last commit message
Last commit date

Latest commit


History

3 Commits


Repository files navigation

Introduction

hiearch is a CLI utility that generates diagrams from textual descriptions, a.k.a., "diagrams as code". Unlike many other generators like graphviz it is designed to support hierarchical decomposition and multiple views, in which sense it is similar to https://structurizr.com. In other words, hiearch generates multiple diagrams (views) from a single description, where each node is a hierarchy of nodes, that is automatically expanded, collapsed, or hidden, depending on configuration of each particular view. Currently, hiearch uses graphviz to generate individual diagrams corresponding to views, but other backends may be added in the future.

The main purpose of hiearch is graphical representation of complex systems, but it is meant to be generic and may find other applications.

Why would anyone need another system diagram generator when there is a multitude of tools that support UML, C4, etc? I believe that the most important aspects of the system are its decomposition into components and connections between them, hiearch provides just that, nothing more, so that you can focus on documenting your system rather than fitting it into a specific design framework.

Features

  • hiearch does not use a DSL, but rather parses a set of input yaml files in arbitrary order. The file contents get composed into a single description, which, in turn, gets decomposed into views.

  • Description files have flat structure without nesting or inclusion and contain lists of the following objects: nodes, edges, and views. Hierarchical relations between nodes are specified using node parameters.

  • Unlike graphviz, hiearch does not have a concept of subgraphs: each node may automatically become a subgraph depending on a view.

  • hiearch is also somewhat stricter than graphviz: for example, all nodes must be defined explicitly and cannot be deduced from edge definitions.

  • View is not the same thing as graphviz layer https://graphviz.org/docs/attrs/layer/: graphviz places all nodes on each layer and simply makes some of them invisible, which results in awkward spacing.

  • hiearch allows nodes to have multiple parent nodes, which is referenced here as 'multiscoping'. The idea is, of course, to show parents in different views, for example, to outline system from logical or hardware point of view. However, it is possible to visualize all parents in the same diagram, which may be a bit kinky.

  • hiearch supports label templates, which facilitates automatic generation of URLs, tables, icon inclusions, etc.

Examples

Command line options

usage: hiearch [-h] [-o OUTPUT] [-f FORMAT] <filename> [<filename> ...]

Generates diagrams

positional arguments:
  <filename>            Input files

optional arguments:
  -h, --help            show this help message and exit
  -o OUTPUT, --output OUTPUT
                        Output directory [hiearch]
  -f FORMAT, --format FORMAT
                        Output format [SVG]

Trivial

-----------------------------------------------------------
nodes:
    - id: ["Test 1", test1]  # [label, unique id]
edges:
    - link: [test1, test1]   # [from node id, to node id]
views:
    - id: view1              # unique id / output filename
      nodes: [test1]         # nodes to include
            
view1
view1

Node relations

-----------------------------------------------------------
nodes:
    - id: ["Test 1", test1]
    - id: ["Test 2", test2]
      graphviz:  # set graphviz attributes directly
        fillcolor: aqua
        style: filled
    - id: ["Test 3", test3]
      scope: test1  # test3 is contained in test1
      style: test2  # test3 inherits all test2 attributes
edges:
    - link: [test3, test3]
views:
    - id: view1
      nodes: [test2, test3]
    - id: view2  # test1 is shown as subgraph
      nodes: [test1, test3]
    - id: view3
      nodes: [test1, test2]
            
view1
view1
view2
view2
view3
view3

Node selection using tags

-----------------------------------------------------------
nodes:
    - id: ["Test 1", test1]
      # tags: ["default"] if not specified
    - id: ["Test 2", test2]
      tags: ["test2_tag"]
edges:
    - link: [test1, test1]
    - link: [test2, test2]
views:
    - id: view1
      tags: ["test2_tag"]
    - id: view2
      tags: ["default"]
            
view1
view1
view2
view2
-----------------------------------------------------------
nodes:
    - id: ["Test 1", test1]
# if no views are specified explicitly, a default one is
# added with 'tags: ["default"]'
            
default
default

Neighbour node selection

-----------------------------------------------------------
nodes:
    - id: ["Test 1", test1]
    - id: ["Test 2", test2]
    - id: ["Test 3", test3]
      scope: test2
edges:
    - link: [test1, test3]
views:
    - id: view1
      nodes: [test1]
      # nodes must be specified explicitly
      # neighbours: explicit
    - id: view2
      nodes: [test1]
      # add connected nodes
      neighbours: direct
    - id: view3
      nodes: [test1]
      # add top most parents of connected nodes
      neighbours: parent
    - id: view4
      # all three together
      tags: ["default"]
            
view1
view1
view2
view2
view3
view3
view4
view4

View styles

-----------------------------------------------------------
nodes:
    - id: ["Test 1", test1]
edges:
    - link: [test1, test1]
views:
    - id: style
      nodes: []  # explicitly empty view is not rendered
      # defaults, overriden by node/edge attributes
      graphviz:
          graph:
              style: filled
              bgcolor: coral
          node:
              fontsize: "24"
              fontname: times
          edge:
              dir: both
    - id: styled
      nodes: [test1]
      style: style  # inherit style from another view
    - id: plain
      nodes: [test1]
            
styled
styled
plain
plain

Edge labels

-----------------------------------------------------------
nodes:
    - id: ["Test 1", test1]
    - id: ["Test 2", test2]
edges:
    - link: [test1, test1]
      label: 'test1_edge'
    - link: [test2, test2]
      label: ['tail', 'middle', 'head']
views:
    - id: view1
      nodes: [test1]
    - id: view2
      nodes: [test2]
            
view1
view1
view2
view2

Edge styles

-----------------------------------------------------------
nodes:
    - id: ["Test 1", test1]
    - id: ["Test 2", test2]
    - id: ["Test 3", test3]
edges:
    - link: [test1, test1]
      label: 'test1'
      graphviz:
        color: red
    # optional third link parameter introduces an explicit
    # id, which must be unique
    - link: [test2, test2, edge2]
      # style can be referenced by link attribute
      style: [test1, test1]
      graphviz:
        dir: both
    - link: [test3, test3]
      # style can also be an explicit id
      style: edge2
      graphviz:
        color: blue
views:
    - id: view1
      nodes: [test1]
    - id: view2
      nodes: [test2]
    - id: view3
      nodes: [test3]
            
view1
view1
view2
view2
view3
view3

Formatted labels

nodes:
    - id: ["Test 1", test1]
      # https://www.svgrepo.com/svg/479843/duck-toy-illustration-3
      # https://www.svgrepo.com/svg/479405/casa-pictogram-5
      graphviz:
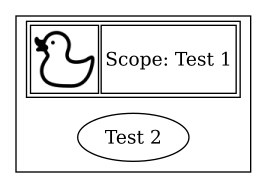
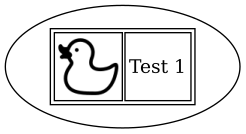
        node_label_format: '<<table><tr><td><img src="https://raw.githubusercontent.com/asherikov/hiearch/master/icon_{id}.svg"/></td><td>{label}</td></tr></table>>'
        scope_label_format: '<<table><tr><td><img src="https://raw.githubusercontent.com/asherikov/hiearch/master/icon_{id}.svg"/></td><td>Scope: {label}</td></tr></table>>'
    - id: ["Test 2", test2]
      scope: test1
    - id: ["Test 3", test3]
      tags: []
      substitutions:
        suffix: '!'
      graphviz:
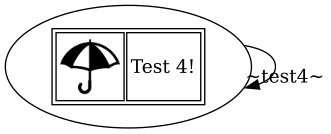
        node_label_format: '<<table><tr><td><img src="https://raw.githubusercontent.com/asherikov/hiearch/master/icon_{style}.svg"/></td><td>{label}{suffix}</td></tr></table>>'
    - id: ["Test 4", test4]
      style: test3
views:
    - id: view1
      nodes: [test1]
    - id: view2
      nodes: [test1, test2]
    - id: view3
      nodes: [test4]

Note that SVG with other embedded SVG is not always rendered properly, and embedded pictures may get lost during conversion to other formats. The PNG files below were generated with rsvg-convert view1.svg --format=png --output=view1.png, exporting directly to PNG using graphviz won't work. Also, the included images must be present in the output directory.
view1
view1
view2
view2
view3
view3

Multiscoping

-----------------------------------------------------------
nodes:
    # root nodes
    - id: ["Test 1", test1]
    - id: ["Test 2", test2]
    # child nodes
    - id: ["Test 3", test3]
      # a child of both root nodes: if both scopes are
      # present in a view they are automatically ranked
      # to form a hierarchy
      scope: [test1, test2]
    # Both root nodes also include non-shared nodes.
    # Since is not possible to visualize overlaping
    # subgraphs with graphviz, one of them is going to be
    # divided into two parts.
    - id: ["Test 4", test4]
      scope: test2
    - id: ["Test 5", test5]
      scope: [test1]
            
default
default

Releases

No releases published

Packages

No packages published