A sample config.yaml file is provided here.
Currently, the system admits a spreadsheet
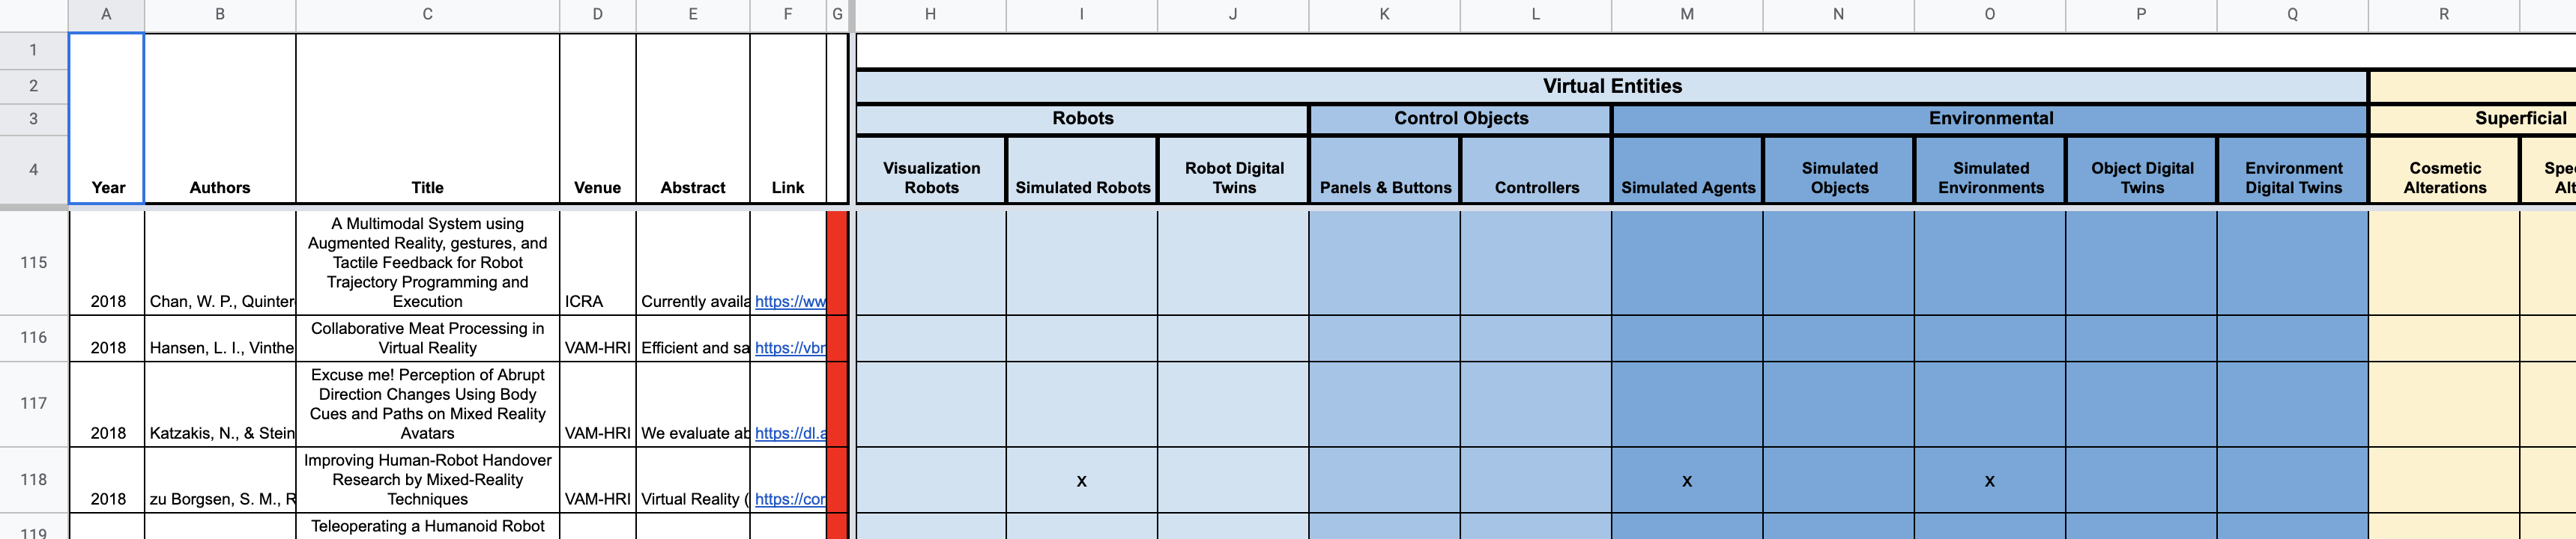
that is organized as a list of papers (rows) underneath a set of categories (columns)
where for each row, each cell is marked depending on whether that paper belongs to
the category on that column or not.
Here is a sample spreadsheet.
This part is pretty self-explanatory.
metadata:
  acronym: VAMHRI
  name: Virtual, Augmented, and Mixed Reality for Human-Robot Interaction
  title_text: 'Virtual, Augmented, and Mixed Reality for Human-Robot Interaction'
  citation_text: "@article{vam-hri, \n title={{Virtual, Augmented, and Mixed
    Reality\n\t for Human-Robot Interaction: A Survey\n\t and Virtual Design Element
    Taxonomy}}, \n author={Michael Walker and Thao Phung and \n\t Tathagata Chakraborti
    and Tom \n\t Williams and Daniel Szafir}, \n journal={ACM Transactions on\n\t  Human-Robot Interaction}, \n
    year={2023}}"
  link_to_code: https://github.com/TathagataChakraborti/survey-visualizer
  primary_link: https://dl.acm.org/doi/10.1145/3597623
  secondary_links:
    - name: VAM-HRI Cube
      link: https://ieeexplore.ieee.org/document/8673071
    - name: Makhataeva et al.
      link: https://www.mdpi.com/2218-6581/9/2/21
    - name: Phaijit et al.
      link: https://dl.acm.org/doi/abs/10.5555/3523760.3523801
  community_link: https://join.slack.com/t/vam-hri/shared_invite/zt-gjq1jtld-PzxfFywTi0qBF6CUX5julw
  info_tile: true
  info_text: Learn more about the VAM-HRI Workshop Series
  info_link:
  - link: https://ojs.aaai.org//index.php/aimagazine/article/view/2822
    text: How it started
  - link: https://vam-hri.github.io/
    text: How it's going
The name field appears as the title of the webpage (name of the tab on your browser). The rest of these fields
appear as follows on the left-hand side [example] as a gateway to the survey resources for the particular deployment:

The primary link should point to the survey paper this deployment is built upon. You can have more than one secondary link, pointing to other papers, or links, that may be of interest.
Note that the link to contribute field should lead directly to wherever the authors of the survey want people to go to make
further contributions or get in touch. For example, a fork of this repository that hosts a deployment for a particular survey.
The next part of the configuration deals with how each view is built. First, set the default view, and from how far back you want to go (this is lower bound, the page will adjust to the earliest paper it finds on the spreadsheet, as seen in green below). The tab to switch views appears on the top-left and the page will load with the default specified.
default_view: Taxonomy
min_year: 1984
This is the method of classification used in the survey. There might be multiple such classifications used in the survey, as is the case in the provided sample config file. Each occurs as a separate tab within that view (seen in green below).
Default Tab First, you need to specify which of the specified tabs to use as the default classification scheme. This view will open with this tab as default. This classification will be used as the basis for the Affinity and Network views as well.
- name: Taxonomy
  disabled: false
  default_tab: Taxonomy
tabs:
    - tab_name: Taxonomy
      title_text: Taxonomy View of VAM-HRI Interaction Design Elements
      root_text: Design Element
      disabled: false
      fancy_chart: false
      input_file:
          filename: data/slug.xlsx
          relative: true
          active_worksheet: Cubed - Thao
      papers_list:
          shuffle_list: true
          key_map:
              title: 4
              abstract:
              authors: 3
              venue: 2
              sessions:
              year: 1
              keywords:
          rows:
              start: 7
              stop: 184
              exclude:
                  - 141
                  - 151
      taxonomy:
          rows:
              start: 1
              stop: 6
              exclude:
                  - 5
                  - 6
          columns:
              start: 69
              stop: 146
For each tab in the Taxonomy view, you can provide a link to the spreadsheet to read from. Unless otherwise specified, we will use
the active sheet as the default sheet to read from (as indicated by the optional default_tab flag).
The path to the file can be marked relative to the directory you are running the compiler
from i.e. path/to/compiler/... or it can be an absolute path (as indicated by the relative flag).
The rows and columns (for either the taxonomy area or the paper list) indicate the start and end of where to read from
in the spreadsheet, as well as rows/columns to ignore if required.
For example, we are asking here to read the "Taxonomy" hierarchy from rows 1-6 (but ignore rows 5 and 6)
and columns 69 to 146, and rows 7-184 (excluding 141 and 151) for the list of papers.
The key_map entry indicates where (columns) the paper metadata is documented in the spreadsheet (e.g. the title is in column 4).
The row and column indices start at 1.
The shuffle_list key, if True, will make the paper list appear in randomized order. If disabled, the papers on the visualizer
appear in the order they are given in the source spreadsheet.
Fancy Charts
You can also enable other views into your taxonomy, such as
using tree maps and circle packs. The fancy_chart_default_level key dictates at what level of the taxonomy (1 being the highest)
the chart is initialized.
- tab_name: Hardware
  title_text: Taxonomy View of VAM-HRI Interaction Design Elements
  disabled: false
  fancy_chart: true
🚨 What if your survey does not have a classification? Don't worry! You can just put a list of papers as under a single class and everything should work fine. Remember to disable the Taxonomy view and mark one of the other ones as the default view.
The affinity tab is meant to provide a view of the papers in the spreadsheet in the space of document similarity. Here "document" equates to the paper metadata provided in the spreadsheet. This view is inspired from the Miniconf repository.
The tags here (highlighted in red) are derived from the default taxonomy you picked in the previous step.
- name: Affinity
  disabled: false

The final view shows a citation network between papers included in the survey. This is extracted automatically from the PDFs of the papers
and is a bit noisy due to varying PDF formats. The extraction is done on a best-guess basis (favoring low false negatives with a bit of high false positives).
You should specify the path (either relative to the compiler script or absolute) to the PDFs in the files_directory field.
You can change the match_threshold to make the best guess more strict. A 0.25 value means that, for all the bits of strings found in the paper
in the "References" sections, a paper title in the known paper list has to be changed at most 25% of itself in order to match, to be considered a potential
reference (with the lowest match below that threshold taken as the matched reference).
- name: Network
  files_directory:
      location: data/pdfs
      relative: true
  match_threshold: 0.25
  disabled: false
As in the previous case, the tags come from the default taxonomy specified previously.

Wanna add a new view? Start a new feature request. 🤗