🚀DevSecOps: Deploy Reddit App to Amazon Elastic Kubernetes Service (EKS) using ArgoCD and monitor its performance ✨
In the fast-paced world of modern software development, the convergence of development, security, and operations, known as DevSecOps, has become essential for delivering secure and reliable applications at scale. As organizations strive to accelerate their release cycles while maintaining high standards of security and reliability, implementing robust DevSecOps practices becomes paramount.
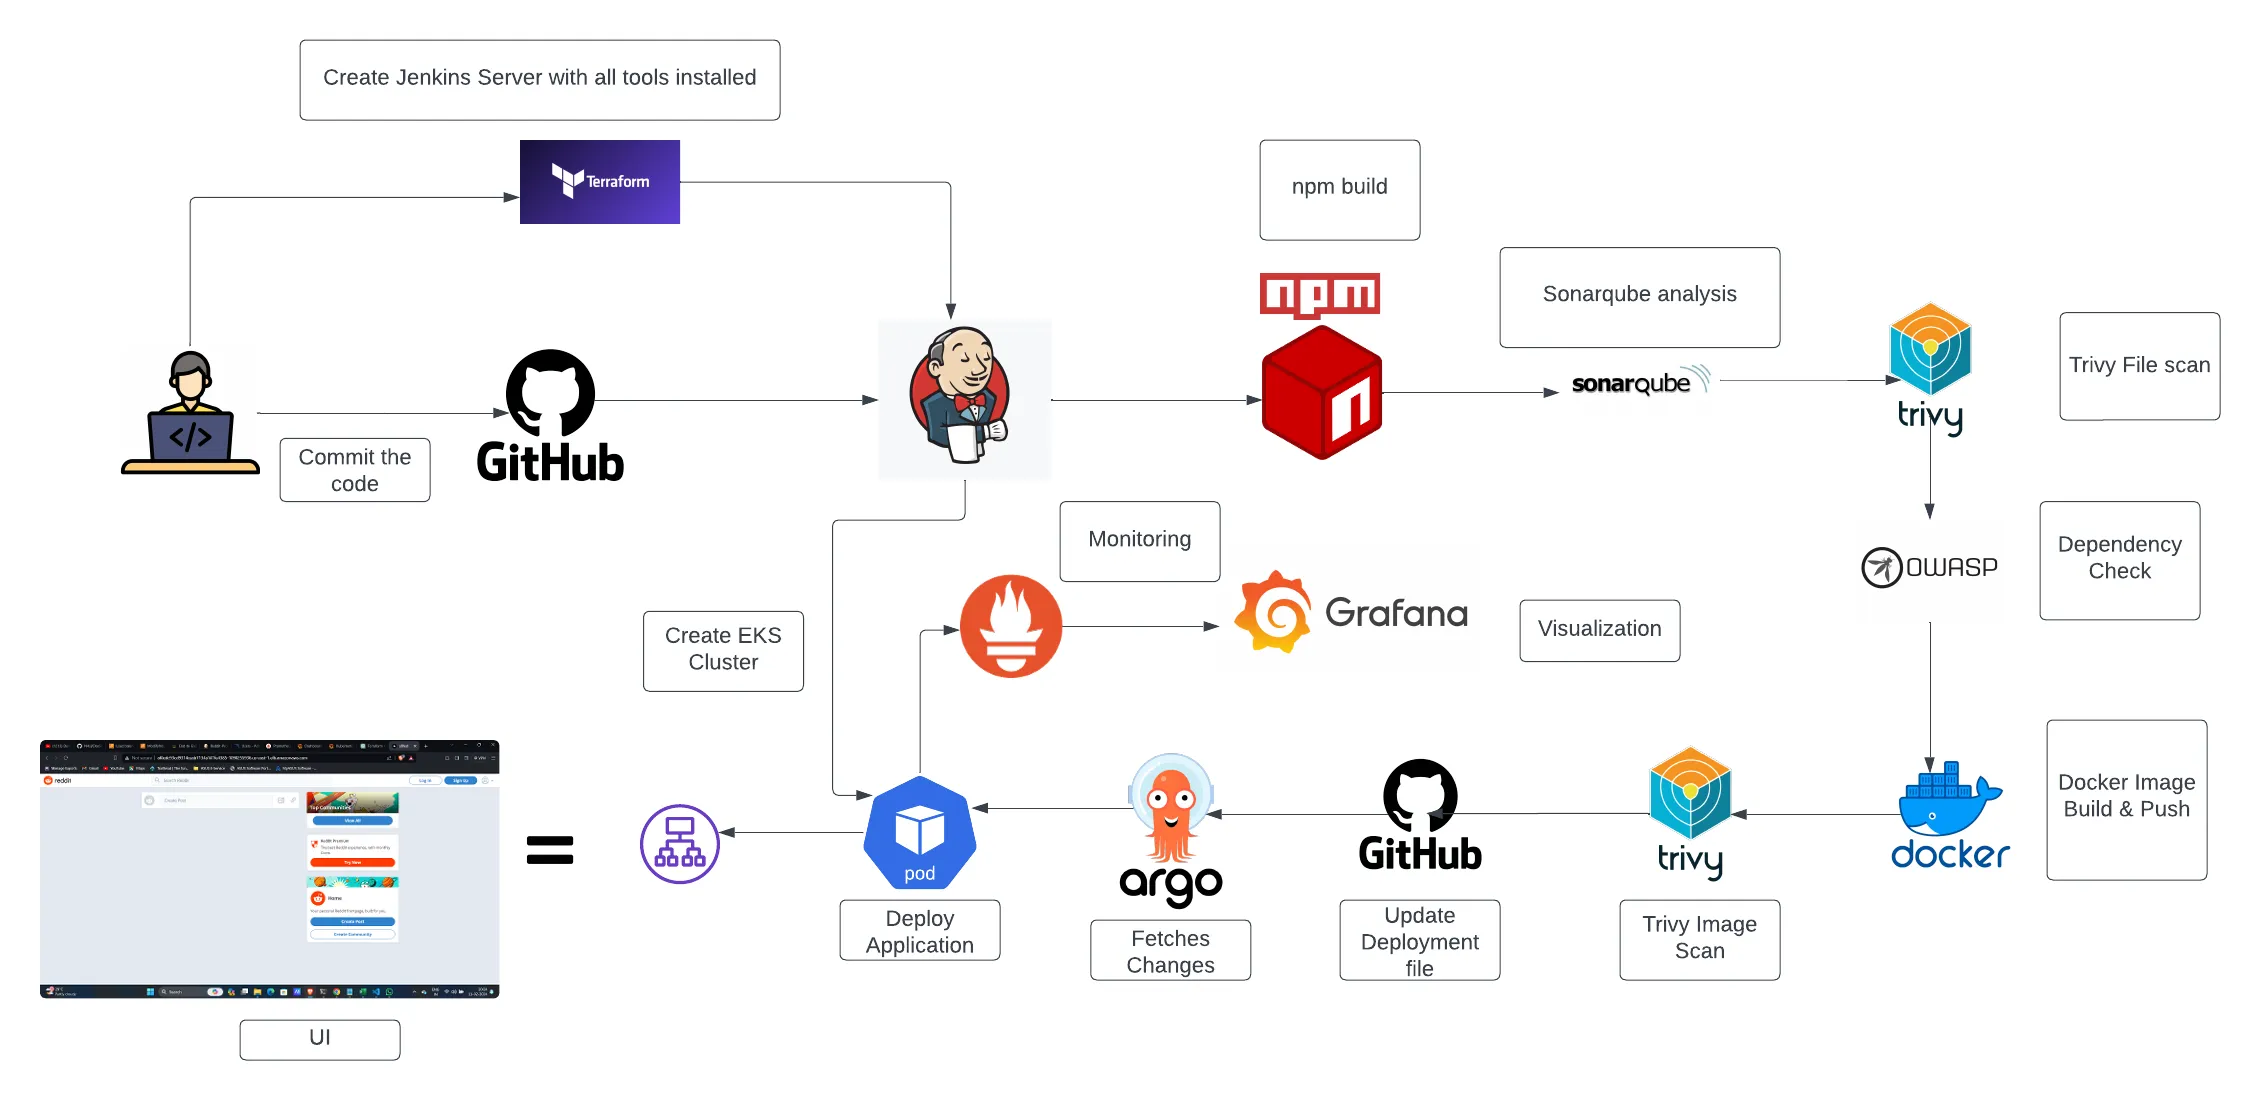
In this blog post, we’ll embark on an exciting journey into the realm of DevSecOps, exploring how to deploy a popular application, Reddit, to Amazon Elastic Kubernetes Service (EKS) using ArgoCD, a GitOps continuous delivery tool, and how to monitor its performance for optimal results.
We’ll delve into each aspect of this process, from setting up the infrastructure on AWS EKS, orchestrating the deployment using ArgoCD, to implementing comprehensive monitoring solutions to ensure the health and performance of our Reddit application.
Join us as we unravel the intricacies of DevSecOps, combining the agility of modern development practices with the robustness of security and operational excellence. By the end of this journey, you’ll gain valuable insights into building resilient and secure cloud-native applications, empowering you to embrace DevSecOps principles in your own projects with confidence and success. Let’s dive in! 🌐🔐
ArgoCD and Amazon Elastic Kubernetes Service (EKS) are two powerful tools that complement each other seamlessly, offering a comprehensive solution for deploying and managing applications in Kubernetes clusters. Let’s explore why ArgoCD and EKS make a compelling combination:
ArgoCD follows the GitOps methodology, where the desired state of the Kubernetes cluster is defined declaratively in Git repositories. This approach brings numerous benefits, including version-controlled configurations, auditability, and the ability to easily roll back changes. By leveraging Git as the single source of truth, ArgoCD ensures consistency and reliability in application deployments.
EKS provides a managed Kubernetes service, abstracting away the complexities of cluster provisioning and management. With EKS, you can focus on deploying and running containerized applications without worrying about the underlying infrastructure. ArgoCD complements EKS by providing declarative configuration management for Kubernetes resources, simplifying the deployment process, and promoting infrastructure-as-code practices.
ArgoCD automates the deployment process, continuously monitoring the Git repositories for changes and reconciling the cluster state to match the desired state defined in the Git repository. This enables rapid and reliable application deployments, allowing teams to iterate and release new features with confidence.
EKS seamlessly integrates with ArgoCD, providing a scalable and reliable platform for running Kubernetes workloads. ArgoCD utilizes Kubernetes-native resources such as Custom Resource Definitions (CRDs) and controllers to manage applications and synchronize their state with the cluster.
Both ArgoCD and EKS offer robust monitoring and observability features. EKS integrates with popular monitoring solutions such as Prometheus and Grafana, allowing you to gain insights into cluster health, performance metrics, and application behavior. ArgoCD provides visibility into the deployment process, including synchronization status, application health, and audit logs, enabling teams to troubleshoot issues effectively.
-
Clone the Repository:
git clone https://github.com/uniquesreedhar/Reddit-Project.git cd Reddit-Project/Jenkins-Server-TF/ -
Modify Backend.tf:
- Create an S3 bucket and a DynamoDB table.
-
Install Terraform and AWS CLI:
# Install Terraform
sudo apt install wget -y
wget -O- https://apt.releases.hashicorp.com/gpg | sudo gpg --dearmor -o /usr/share/keyrings/hashicorp-archive-keyring.gpg
echo "deb [signed-by=/usr/share/keyrings/hashicorp-archive-keyring.gpg] https://apt.releases.hashicorp.com $(lsb_release -cs) main" | sudo tee /etc/apt/sources.list.d/hashicorp.list
sudo apt update && sudo apt install terraform

# Install AWS CLI
curl "https://awscli.amazonaws.com/awscli-exe-linux-x86_64.zip" -o "awscliv2.zip"
sudo apt-get install unzip -y
unzip awscliv2.zip
sudo ./aws/install

# Configure AWS CLI
aws configure
Provide your AWS Access Key ID, Secret Access Key, region name, and output format.
-
Run Terraform Commands:
terraform init
terraform validate
terraform plan -var-file=variables.tfvars
terraform apply -var-file=variables.tfvars --auto-approve
- This will create an instance on AWS.
-
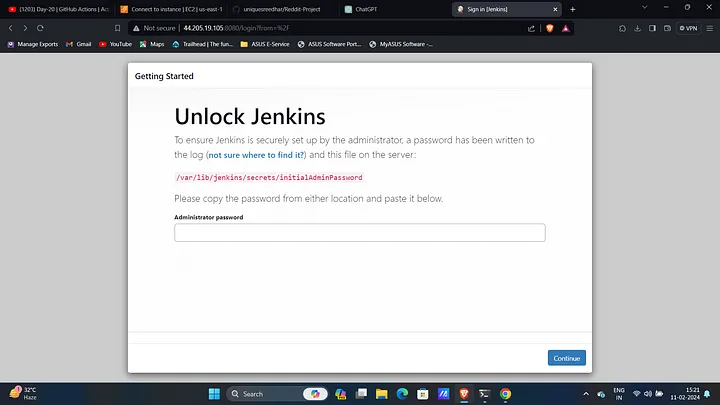
Access Jenkins:
-
Copy the public IP of the instance and access Jenkins on your favorite browser:
<public_ip>:8080
-
-
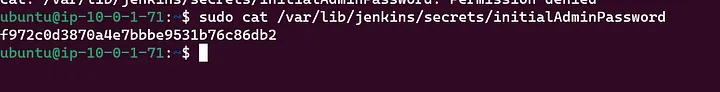
Get Jenkins Password:
- Connect to the instance and retrieve the password.
-
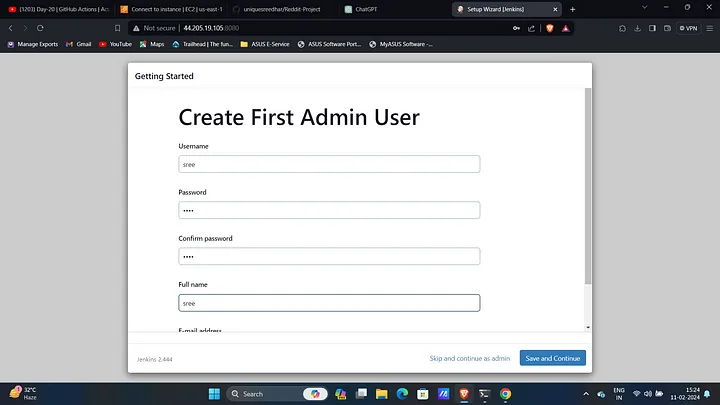
Create Jenkins User:
- (Optional) Create a user if you don’t want to keep the default password.
-
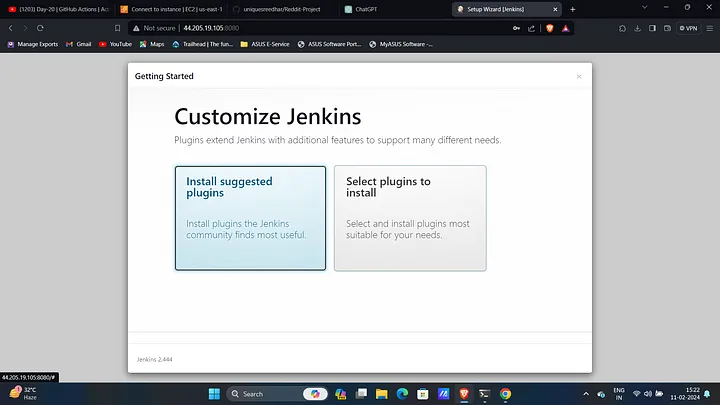
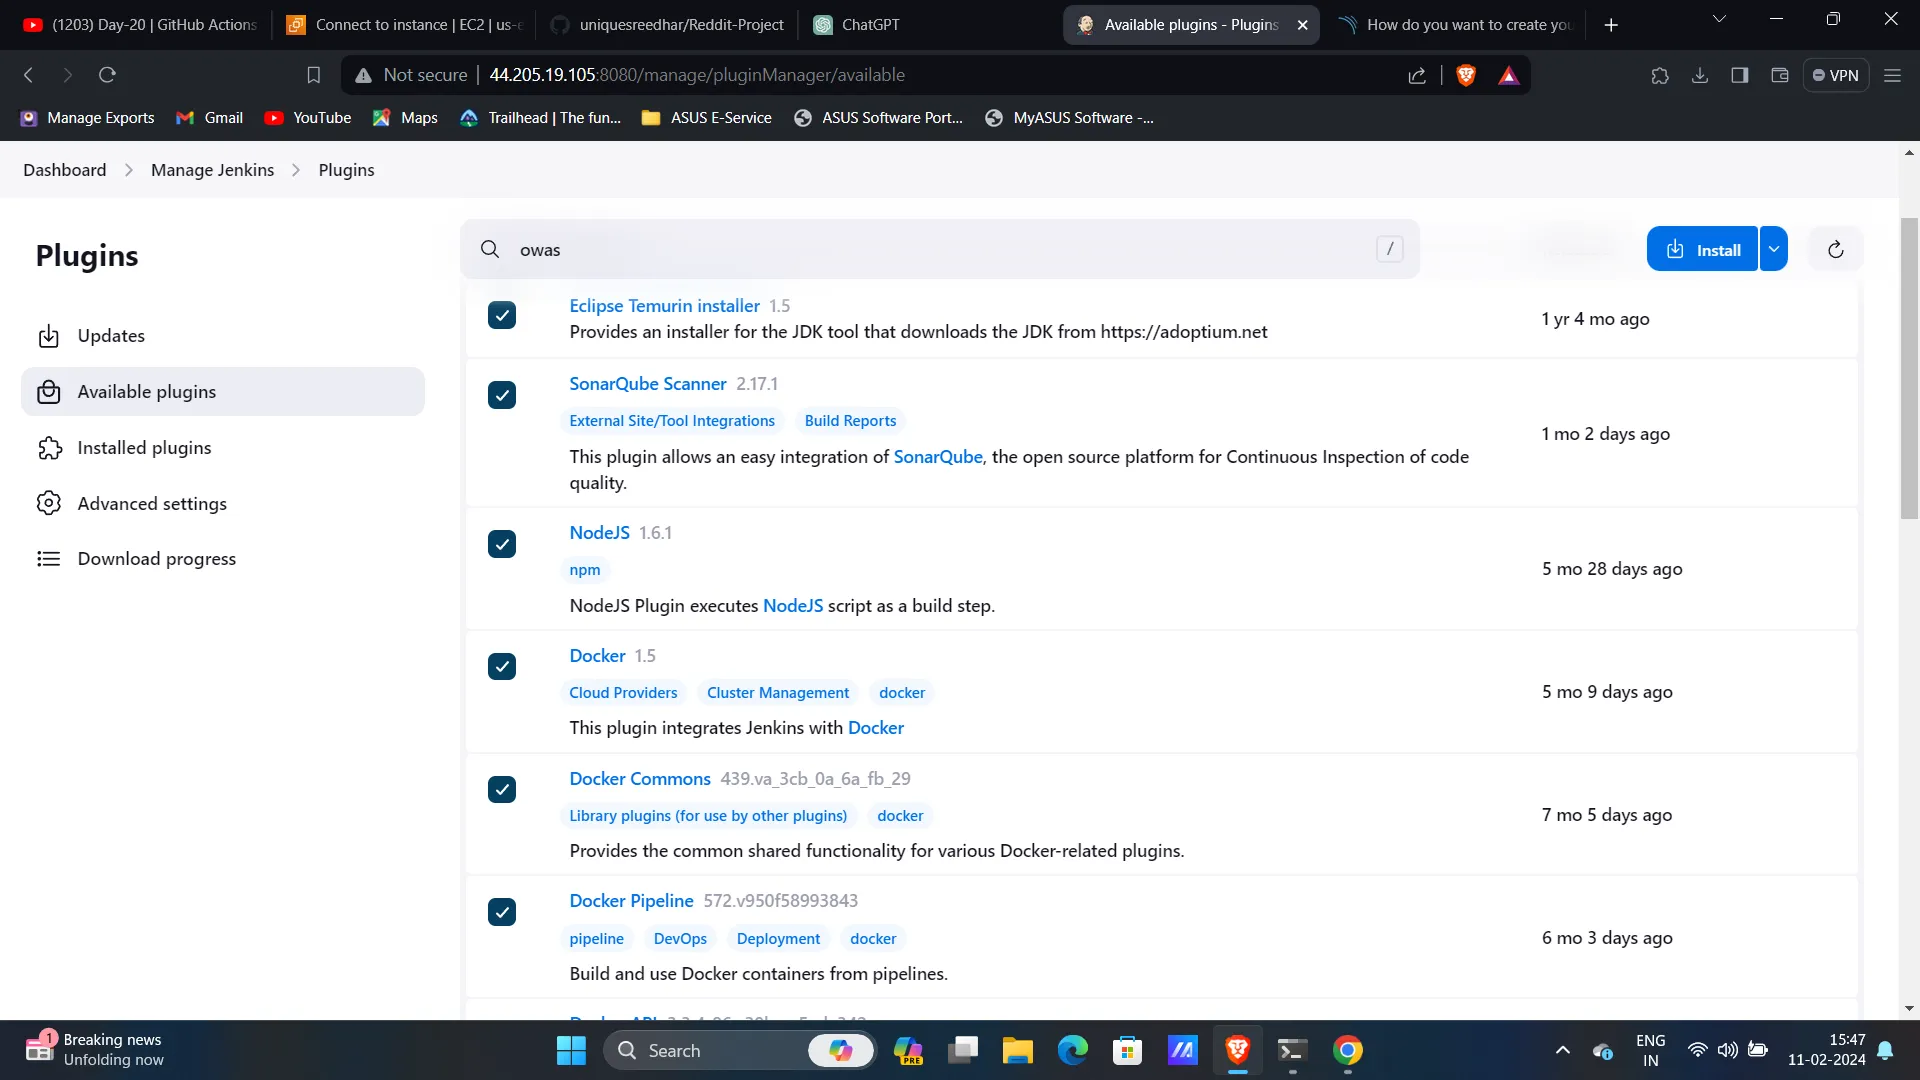
Install Required Plugins:
- Navigate to Manage Jenkins → Plugins → Available Plugins and install the following plugins without restarting:
- Eclipse Temurin Installer
- SonarQube Scanner
- NodeJs Plugin
- Docker Plugins (Docker, Docker commons, Docker pipeline, Docker API, Docker Build step)
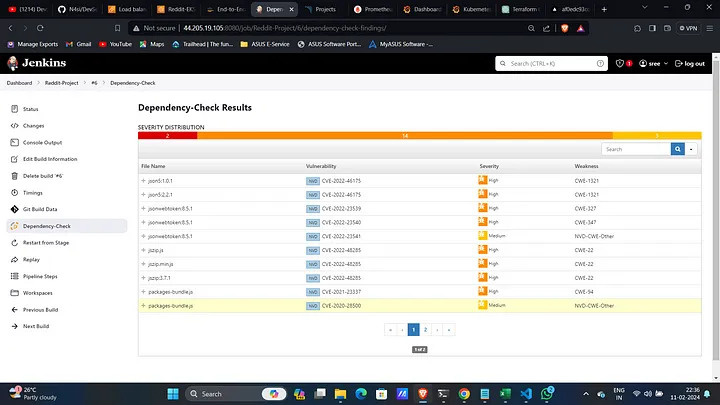
- Owasp Dependency Check
- Terraform
- AWS Credentials
- Pipeline: AWS Steps
- Prometheus Metrics Plugin
- Navigate to Manage Jenkins → Plugins → Available Plugins and install the following plugins without restarting:
-
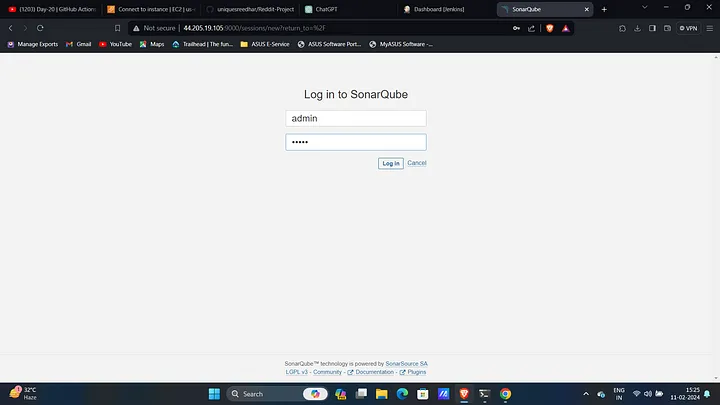
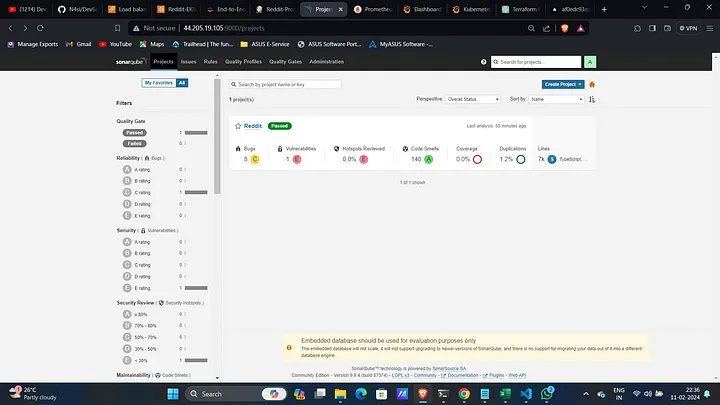
Access SonarQube Console:
<public_ip>:9000- Both Username and Password are "admin". Update the password and configure as needed.
-
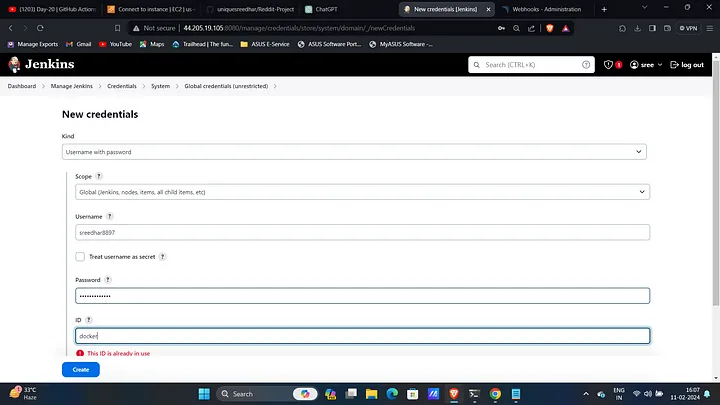
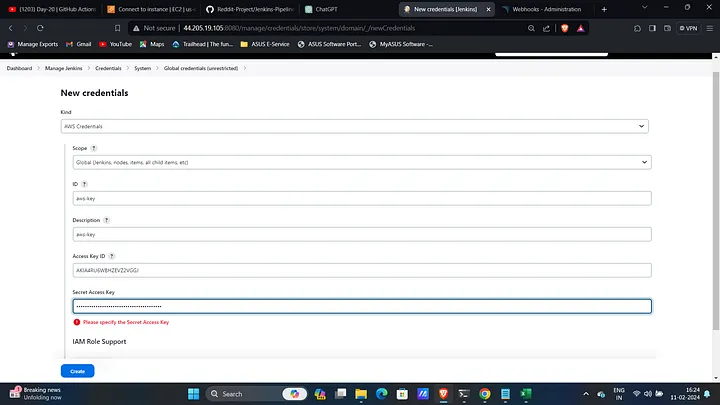
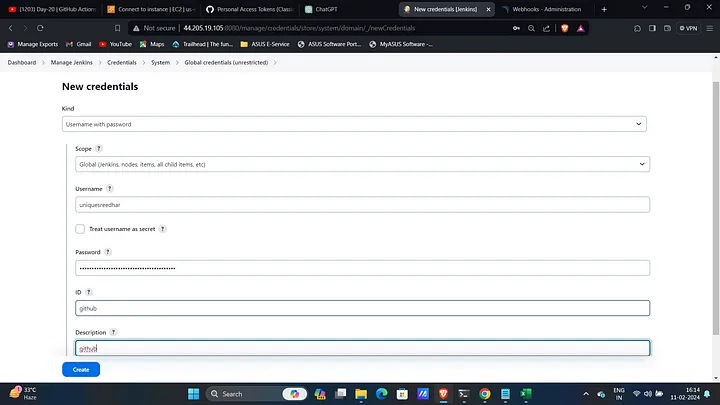
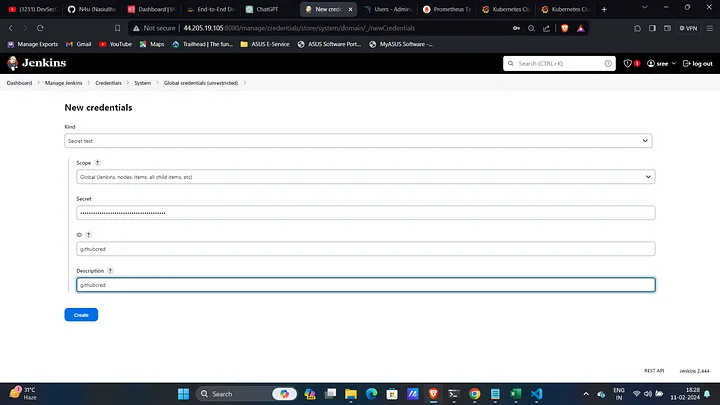
Create and Configure Credentials:
- Navigate to Manage Jenkins → Credentials → Global and create credentials for AWS, GitHub, and Docker.
-
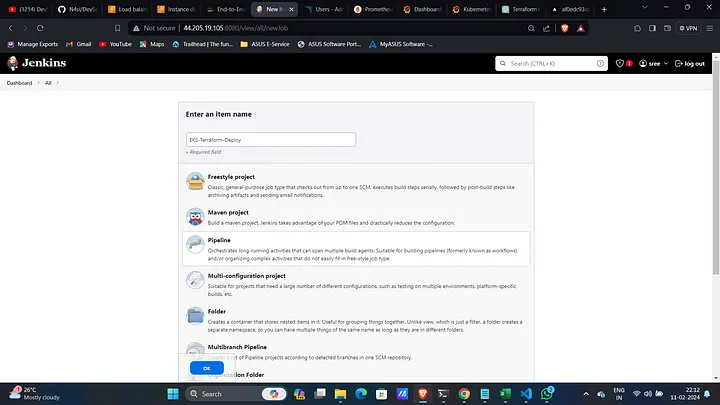
Create a New Jenkins Pipeline:
- Click on New Item, give a name, select Pipeline, and click OK.
-
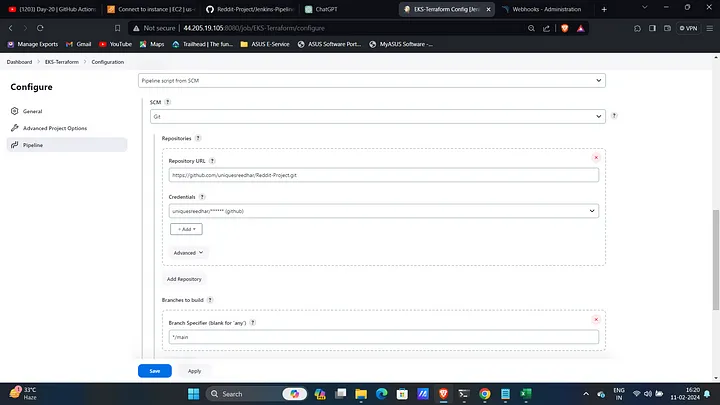
Configure Pipeline:
- Navigate to the Pipeline section, provide the GitHub URL of your project, and specify the credentials and the path to the Jenkinsfile.
-
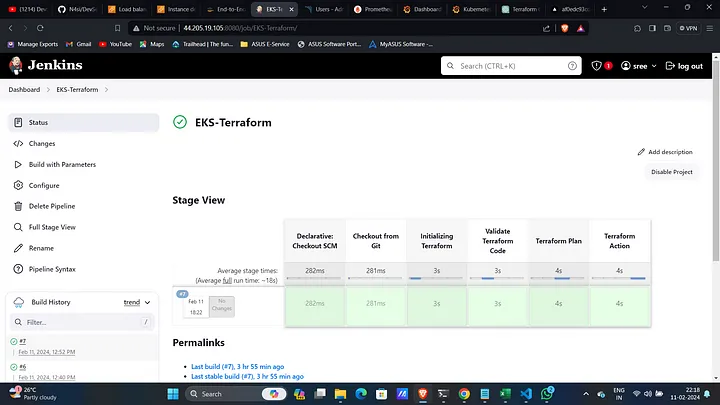
Build the Pipeline:
- Click Apply and then Build. This will create an EKS cluster.
-
Create a New Jenkins Job:
- Click on New Item, give a name, select Pipeline, and click OK.
-
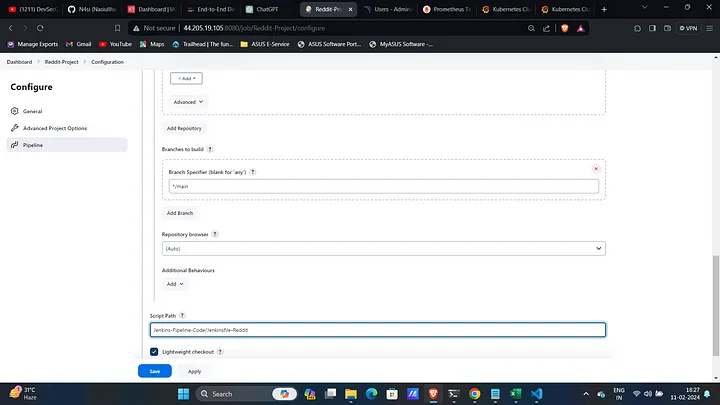
Configure Jenkins Job:
- In the pipeline section:
- Choose Script from SCM.
- Set up Git with your GitHub credentials.
- Set the branch as
mainand the pipeline path asJenkins-Pipeline-Code/Jenkinsfile-Reddit.
- In the pipeline section:
-
Build the Pipeline:
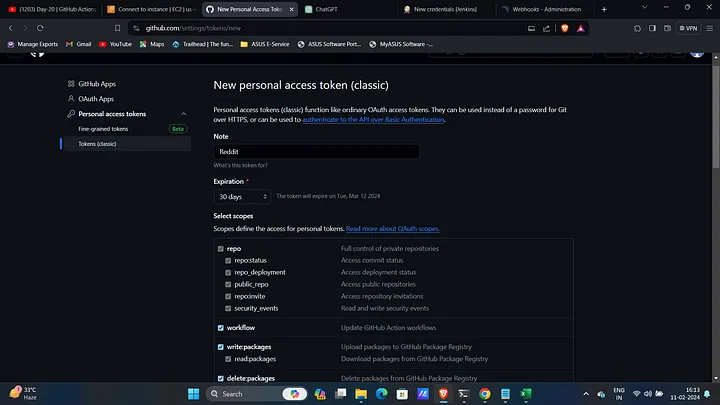
- Before building, create a GitHub token as secret text with the ID
githubcredto update the built image in the deployment.yml file.
- Before building, create a GitHub token as secret text with the ID
-
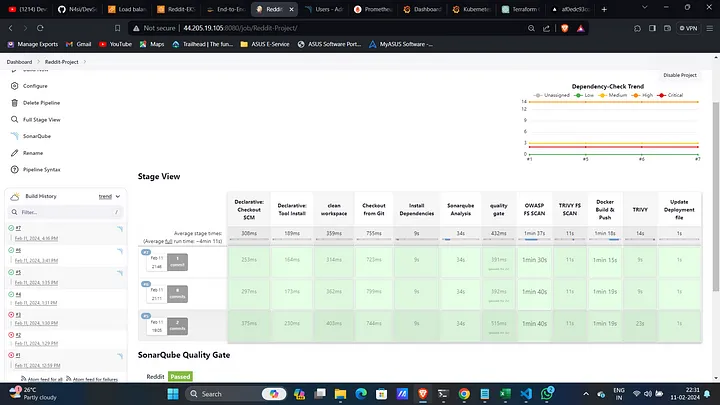
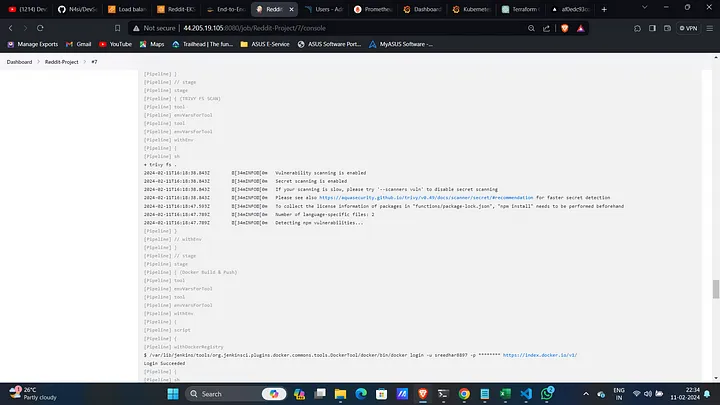
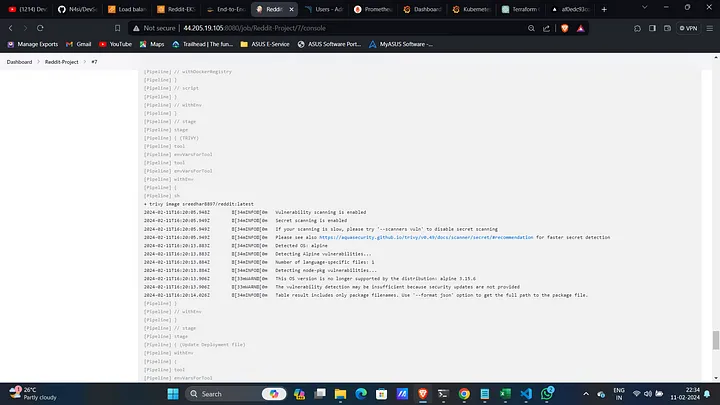
Check Scanning Results:
- View Trivy scan results, SonarQube analysis, and Dependency Checker outputs.
-
Update Deployment File:
- The deployment file will be updated with the tag of the Jenkins build number.

-
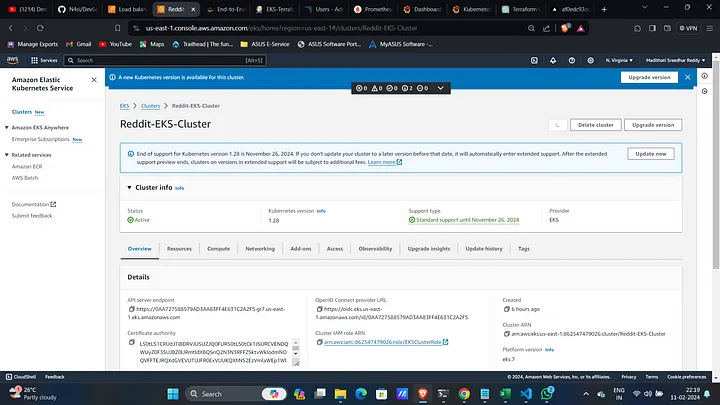
Update EKS Cluster Config:
aws eks update-kubeconfig --name Reddit-EKS-Cluster
-
Install ArgoCD:
kubectl create namespace argocd
kubectl apply -n argocd -f https://raw.githubusercontent.com/argoproj/argo-cd/v2.4.7/manifests/install.yaml
-
Expose ArgoCD Server:
kubectl patch svc argocd-server -n argocd -p '{"spec": {"type": "LoadBalancer"}}' -
Retrieve ArgoCD Server Info:
export ARGOCD_SERVER=`kubectl get svc argocd-server -n argocd -o json | jq --raw-output '.status.loadBalancer.ingress[0].hostname'`
export ARGO_PWD=`kubectl -n argocd get secret argocd-initial-admin-secret -o jsonpath="{.data.password}" | base64 -d`
-
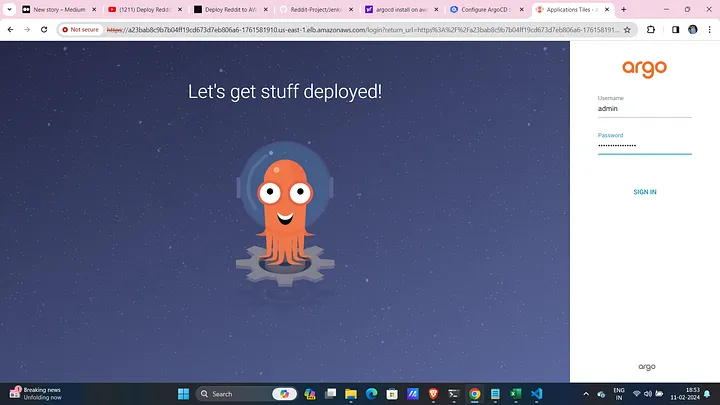
Access ArgoCD Console:
- Login using the DNS name and credentials.
-
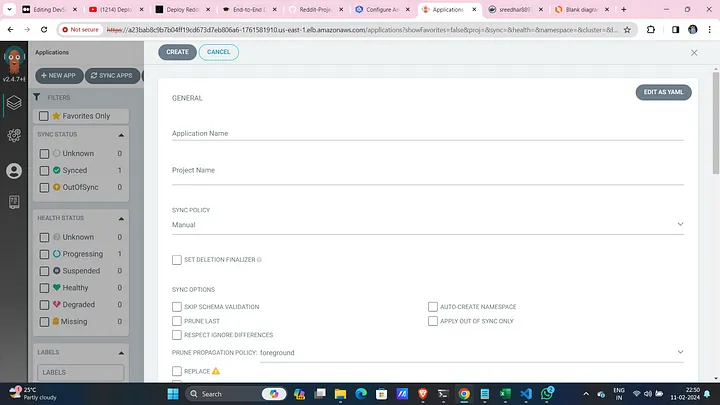
Create ArgoCD Application:
- Click on Create App, edit the YAML, and replace
repoURLwith your GitHub project URL:
project: default
source:
  repoURL: 'https://github.com/uniquesreedhar/Reddit-Project.git'
  path: K8s/
  targetRevision: HEAD
destination:
  server: 'https://kubernetes.default.svc'
  namespace: default
syncPolicy:
  automated:
    prune: true
    selfHeal: true
- Click on Create App, edit the YAML, and replace
-
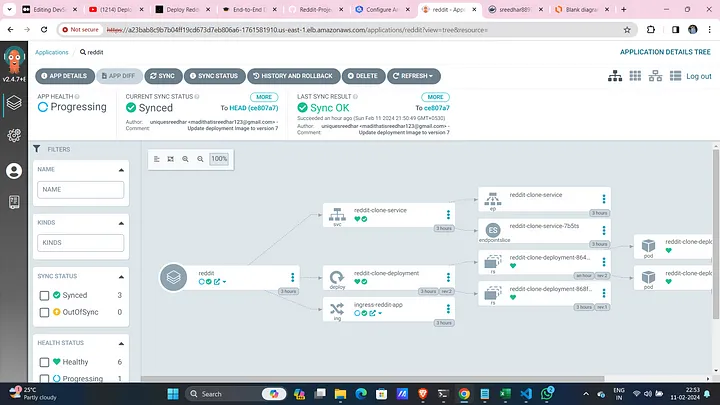
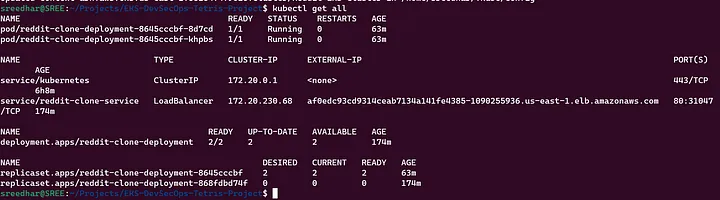
Deploy and Sync:
- Deploy and sync your Reddit application with EKS.

-
Deploy Prometheus and Grafana:
kubectl apply -f https://raw.githubusercontent.com/uniquesreedhar/Reddit-Project/main/Prometheus/
-
Expose Prometheus and Grafana:
kubectl expose pod <prometheus-pod> --port=8080 --target-port=9090 --name=prometheus-lb --type=LoadBalancer
kubectl expose pod <grafana-pod> --port=8081 --target-port=3000 --name=grafana-lb --type=LoadBalancer
-
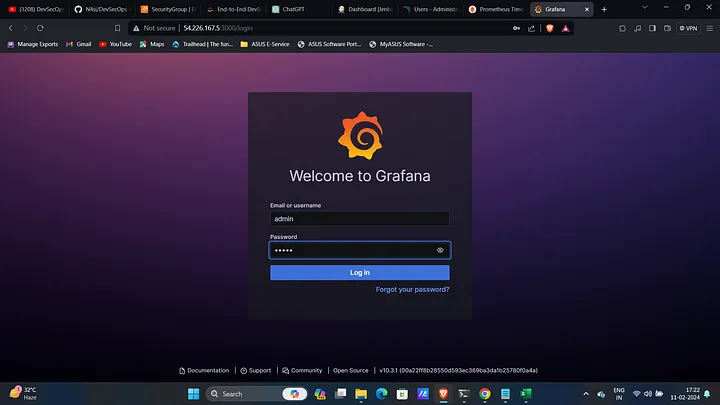
Access Grafana:
- Copy the public IP and access it through
<public_ip>:8081.
- Copy the public IP and access it through
-
Login to Grafana:
- Default credentials:
admin/admin.
- Default credentials:
-
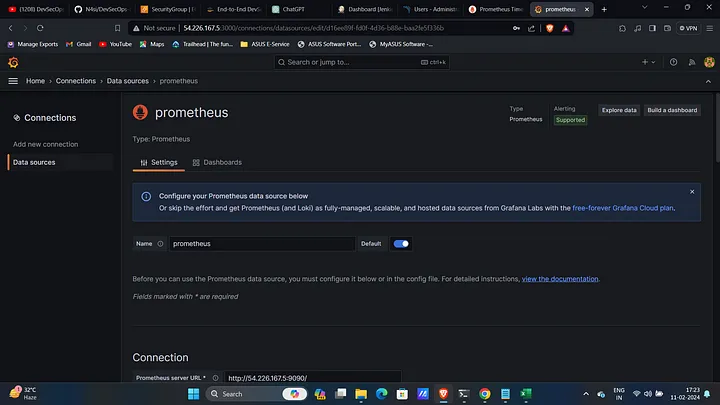
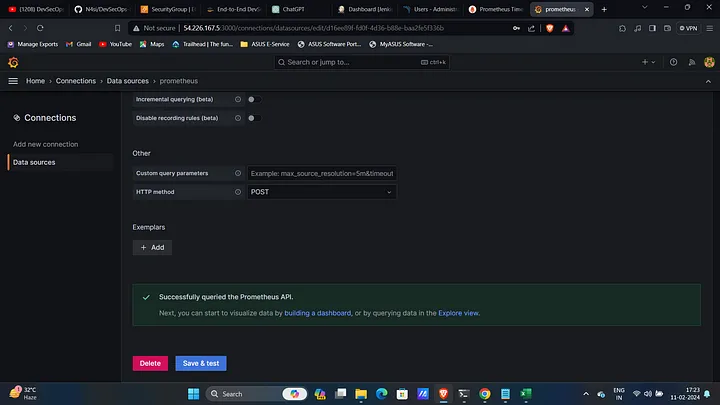
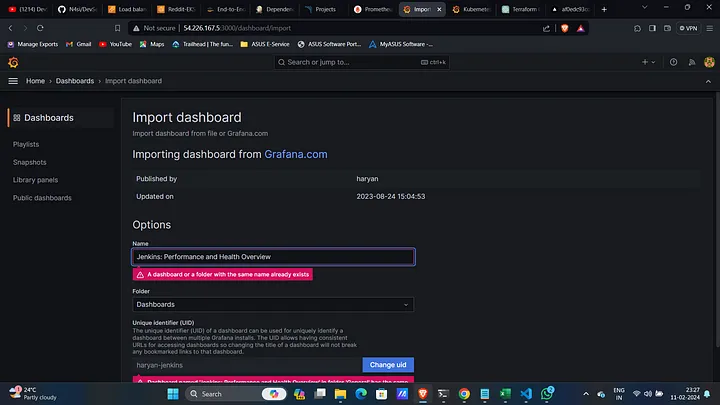
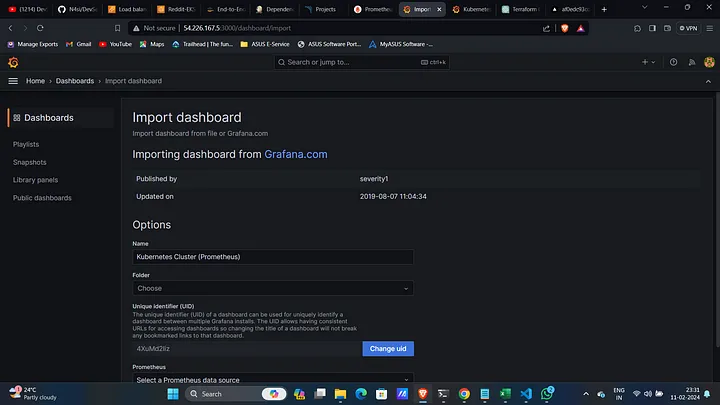
Add Prometheus Data Source in Grafana:
- Navigate to Add Data Source → Prometheus.
- Set up and start monitoring.
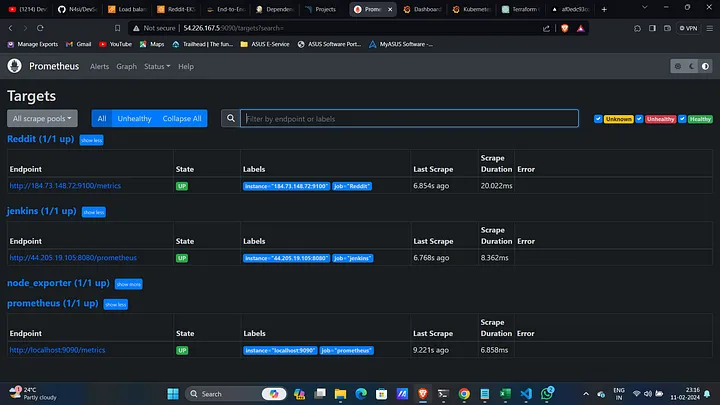
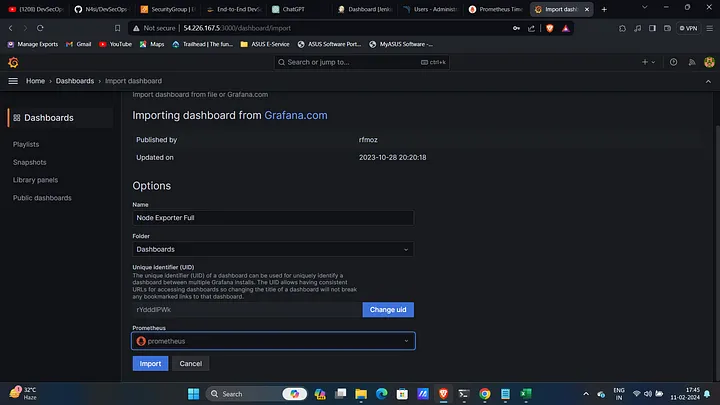
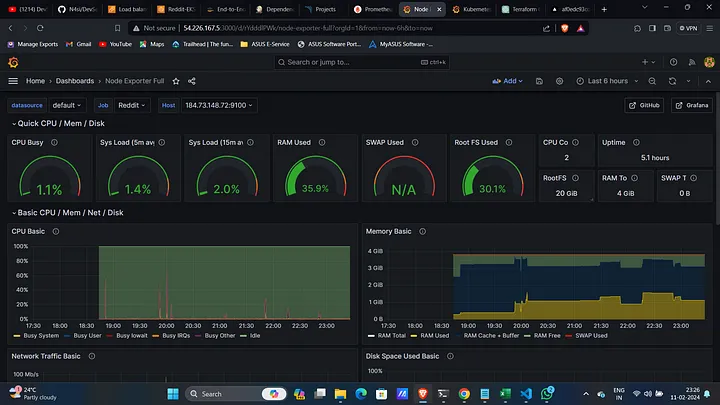
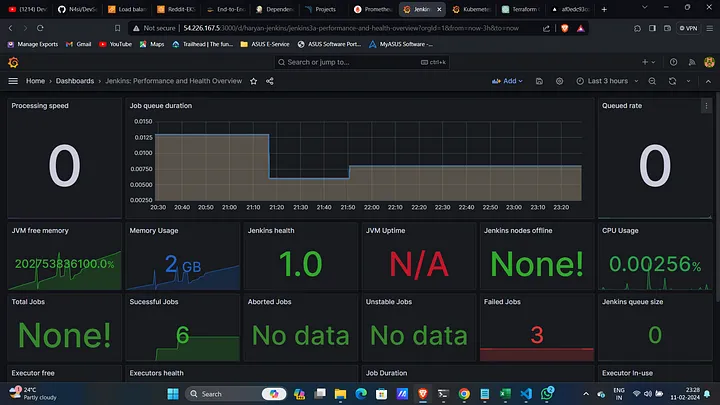
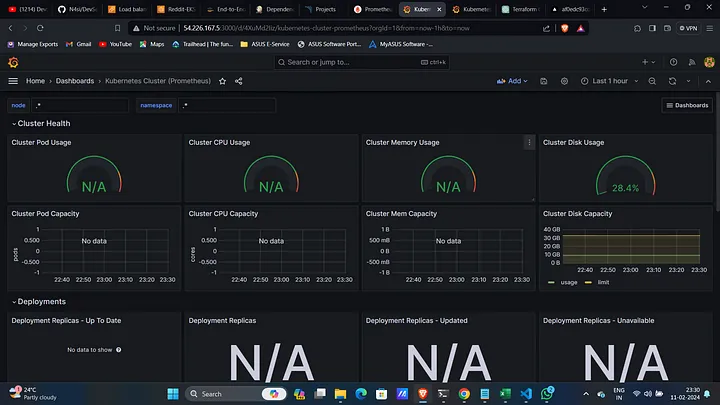
After setting up monitoring, you'll have access to detailed metrics from Prometheus, displayed on Grafana dashboards. These metrics help in identifying bottlenecks, understanding application behavior under load, and ensuring that everything runs smoothly. This proactive approach helps in maintaining high availability and performance, ensuring your application is always up and running.
By integrating Jenkins, ArgoCD, AWS EKS, and monitoring tools like Prometheus and Grafana, you create a robust pipeline that automates the deployment, security scanning, and monitoring of your applications. This setup is ideal for embracing DevSecOps practices, allowing your teams to focus on delivering value while ensuring security and reliability.

Note
Join Our Telegram Community // Follow me for more DevOps & Cloud content.