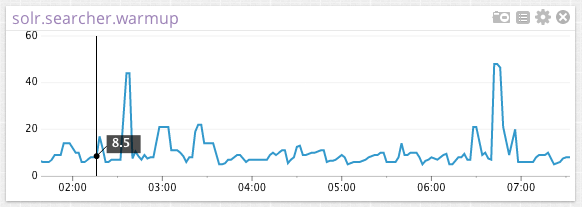
The Solr check tracks the state and performance of a Solr cluster. It collects metrics like number of documents indexed, cache hits and evictions, average request times, average requests per second, and more.
The Solr check is included in the Datadog Agent package, so you don't need to install anything else on your Solr nodes.
This check is JMX-based, so you'll need to enable JMX Remote on your Solr servers. Read the JMX Check documentation for more information on that.
Edit the solr.d/conf.yaml file, in the conf.d/ folder at the root of your Agent's configuration directory. See the sample solr.d/conf.yaml for all available configuration options:
instances:
  # location of tomcat
  - host: localhost
    port: 9999

  # if tomcat requires authentication
  #   user: <TOMCAT_USERNAME>
  #   password: <TOMCAT_PASSWORD>

init_config:
  conf:
    - include:
      type: searcher
      attribute:
        maxDoc:
          alias: solr.searcher.maxdoc
          metric_type: gauge
        numDocs:
          alias: solr.searcher.numdocs
          metric_type: gauge
        warmupTime:
          alias: solr.searcher.warmup
          metric_type: gauge
    - include:
      id: org.apache.solr.search.FastLRUCache
      attribute:
        cumulative_lookups:
          alias: solr.cache.lookups
          metric_type: counter
        cumulative_hits:
          alias: solr.cache.hits
          metric_type: counter
        cumulative_inserts:
          alias: solr.cache.inserts
          metric_type: counter
        cumulative_evictions:
          alias: solr.cache.evictions
          metric_type: counter
    - include:
      id: org.apache.solr.search.LRUCache
      attribute:
        cumulative_lookups:
          alias: solr.cache.lookups
          metric_type: counter
        cumulative_hits:
          alias: solr.cache.hits
          metric_type: counter
        cumulative_inserts:
          alias: solr.cache.inserts
          metric_type: counter
        cumulative_evictions:
          alias: solr.cache.evictions
          metric_type: counter
    - include:
      id: org.apache.solr.handler.component.SearchHandler
      attribute:
        errors:
          alias: solr.search_handler.errors
          metric_type: counter
        requests:
          alias: solr.search_handler.requests
          metric_type: counter
        timeouts:
          alias: solr.search_handler.timeouts
          metric_type: counter
        totalTime:
          alias: solr.search_handler.time
          metric_type: counter
        avgTimePerRequest:
          alias: solr.search_handler.avg_time_per_req
          metric_type: gauge
        avgRequestsPerSecond:
          alias: solr.search_handler.avg_requests_per_sec
          metric_type: gauge
Again, see the JMX Check documentation for a list of configuration options usable by all JMX-based checks. The page also describes how the Agent tags JMX metrics.
Restart the Agent to start sending Solr metrics to Datadog.
Configuration Options
userandpassword(Optional) - Username and password.process_name_regex- (Optional) - Instead of specifying a host and port or jmx_url, the agent can connect using the attach api. This requires the JDK to be installed and the path to tools.jar to be set.tools_jar_path- (Optional) - To be set when process_name_regex is set.java_bin_path- (Optional) - Should be set if the agent cannot find your java executable.java_options- (Optional) - Java JVM optionstrust_store_pathandtrust_store_password- (Optional) - Should be set if ssl is enabled.
The conf parameter is a list of dictionaries. Only 2 keys are allowed in this dictionary:
include(mandatory): Dictionary of filters, any attribute that matches these filters will be collected unless it also matches the "exclude" filters (see below)exclude(optional): Another dictionary of filters. Attributes that match these filters won't be collected
For a given bean, metrics get tagged in the following manner:
mydomain:attr0=val0,attr1=val1
Your metric will be mydomain (or some variation depending on the attribute inside the bean) and have the tags attr0:val0, attr1:val1, domain:mydomain.
If you specify an alias in an include key that is formatted as camel case, it will be converted to snake case. For example, MyMetricName will be shown in Datadog as my_metric_name.
The attribute filter can accept two types of values:
-
A dictionary whose keys are attributes names:
conf:
  - include:
    attribute:
      maxThreads:
        alias: tomcat.threads.max
        metric_type: gauge
      currentThreadCount:
        alias: tomcat.threads.count
        metric_type: gauge
      bytesReceived:
        alias: tomcat.bytes_rcvd
        metric_type: counter
In that case you can specify an alias for the metric that will become the metric name in Datadog. You can also specify the metric type either a gauge or a counter. If you choose counter, a rate per second will be computed for this metric.
-
A list of attributes names:
conf:
  - include:
    domain: org.apache.cassandra.db
    attribute:
      - BloomFilterDiskSpaceUsed
      - BloomFilterFalsePositives
      - BloomFilterFalseRatio
      - Capacity
      - CompressionRatio
      - CompletedTasks
      - ExceptionCount
      - Hits
      - RecentHitRate
In that case:
- The metric type is a gauge
- The metric name is
jmx.\[DOMAIN_NAME].\[ATTRIBUTE_NAME]
Here is another filtering example:
instances:
  - host: 127.0.0.1
    name: jmx_instance
    port: 9999

init_config:
  conf:
    - include:
      bean: org.apache.cassandra.metrics:type=ClientRequest,scope=Write,name=Latency
      attribute:
        - OneMinuteRate
        - 75thPercentile
        - 95thPercentile
        - 99thPercentile
List of filters is only supported in Datadog Agent > 5.3.0. If you are using an older version, please use singletons and multiple include statements instead.
# Datadog Agent > 5.3.0
  conf:
    - include:
      domain: domain_name
      bean:
        - first_bean_name
        - second_bean_name

# Older Datadog Agent versions
  conf:
    - include:
      domain: domain_name
      bean: first_bean_name
    - include:
      domain: domain_name
      bean: second_bean_name
Run the Agent's status subcommand and look for solr under the Checks section.
See metadata.csv for a list of metrics provided by this check.
The Solr check does not include any events at this time.
solr.can_connect
Returns CRITICAL if the Agent is unable to connect to and collect metrics from the monitored SolR instance. Returns OK otherwise.
The datadog-agent jmx command was added in version 4.1.0.
- List attributes that match at least one of your instances configuration:
sudo /etc/init.d/datadog-agent jmx list_matching_attributes - List attributes that do match one of your instances configuration but that are not being collected because it would exceed the number of metrics that can be collected:
sudo /etc/init.d/datadog-agent jmx list_limited_attributes - List attributes that will actually be collected by your current instances configuration:
sudo /etc/init.d/datadog-agent jmx list_collected_attributes - List attributes that don't match any of your instances configuration:
sudo /etc/init.d/datadog-agent jmx list_not_matching_attributes - List every attributes available that has a type supported by JMXFetch:
sudo /etc/init.d/datadog-agent jmx list_everything - Start the collection of metrics based on your current configuration and display them in the console:
sudo /etc/init.d/datadog-agent jmx collect
If your jmxfetch returns only string values like false and true and you want to transform it into a Datadog gauge metric for advanced usages. For instance if you want the following equivalence for your jmxfetch:
"myJmxfetch:false" = myJmxfetch:0
"myJmxfetch:true" = myJmxfetch:1
You may use the attribute filter as follow:
...
    attribute:
          myJmxfetch:
            alias: your_metric_name
            metric_type: gauge
            values:
              "false": 0
              "true": 1
