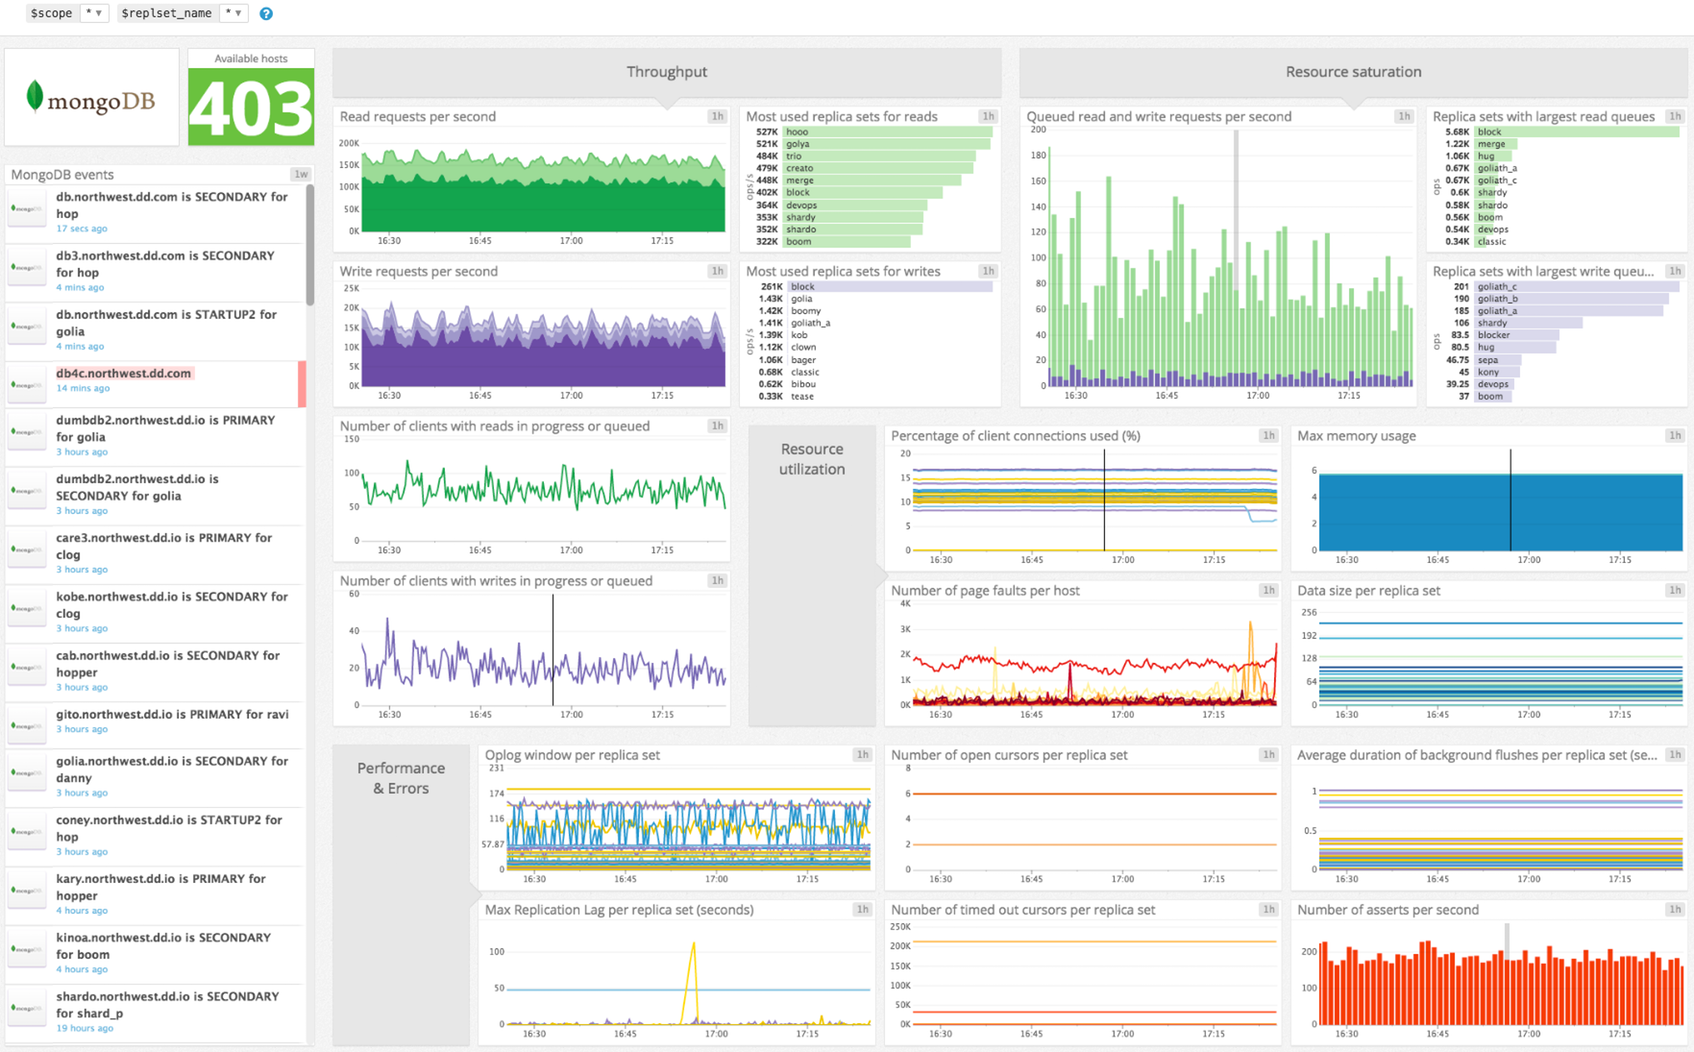
Connect MongoDB to Datadog in order to:
- Visualize key MongoDB metrics.
- Correlate MongoDB performance with the rest of your applications.
You can also create your own metrics using custom find, count and aggregate queries.
Follow the instructions below to install and configure this check for an Agent running on a host. For containerized environments, see the Autodiscovery Integration Templates for guidance on applying these instructions.
The MongoDB check is included in the Datadog Agent package, so you don't need to install anything else on your MongoDB masters.
Edit the mongo.d/conf.yaml file, in the conf.d/ folder at the root of your Agent's configuration directory to start collecting your MongoDB metrics and logs. See the sample mongo.yaml for all available configuration options.
In a mongo shell, create a read-only user for the Datadog Agent in the admin database:
# Authenticate as the admin user.
use admin
db.auth("admin", "<YOUR_MONGODB_ADMIN_PASSWORD>")

# On MongoDB 2.x, use the addUser command.
db.addUser("datadog", "<UNIQUEPASSWORD>", true)

# On MongoDB 3.x or higher, use the createUser command.
db.createUser({
  "user":"datadog",
  "pwd": "<UNIQUEPASSWORD>",
  "roles" : [
    {role: 'read', db: 'admin' },
    {role: 'clusterMonitor', db: 'admin'},
    {role: 'read', db: 'local' }
  ]
})
-
Add this configuration block to your
mongo.d/conf.yamlfile to start gathering your MongoDB Metrics:init_config: instances: - server: mongodb://datadog:<UNIQUEPASSWORD>@localhost:27017/admin additional_metrics: - collection # collect metrics for each collection - metrics.commands - tcmalloc - topSee the sample mongo.yaml for all available configuration options, including those for custom metrics.
-
Restart the Agent to start sending MongoDB metrics to Datadog.
Available for Agent >6.0
-
Collecting logs is disabled by default in the Datadog Agent, enable it in your
datadog.yamlfile:logs_enabled: true
-
Add this configuration block to your
mongo.d/conf.yamlfile to start collecting your MongoDB Logs:logs: - type: file path: /var/log/mongodb/mongodb.log service: mongo source: mongodb
Change the
serviceandpathparameter values and configure them for your environment. See the sample mongo.yaml for all available configuration options
Run the Agent's status subcommand and look for mongo under the Checks section.
See metadata.csv for a list of metrics provided by this check.
See the MongoDB 3.0 Manual for more detailed descriptions of some of these metrics.
NOTE: The following metrics are NOT collected by default:
| metric prefix | what to add to additional_metrics to collect it |
| mongodb.collection | collection |
| mongodb.commands | top |
| mongodb.getmore | top |
| mongodb.insert | top |
| mongodb.queries | top |
| mongodb.readLock | top |
| mongodb.writeLock | top |
| mongodb.remove | top |
| mongodb.total | top |
| mongodb.update | top |
| mongodb.writeLock | top |
| mongodb.tcmalloc | tcmalloc |
| mongodb.metrics.commands | metrics.commands |
Replication state changes:
This check emits an event each time a Mongo node has a change in its replication state.
mongodb.can_connect:
Returns CRITICAL if the Agent cannot connect to MongoDB to collect metrics, otherwise returns OK.
Need help? Contact Datadog support.
Read our series of blog posts about collecting metrics from MongoDB with Datadog: