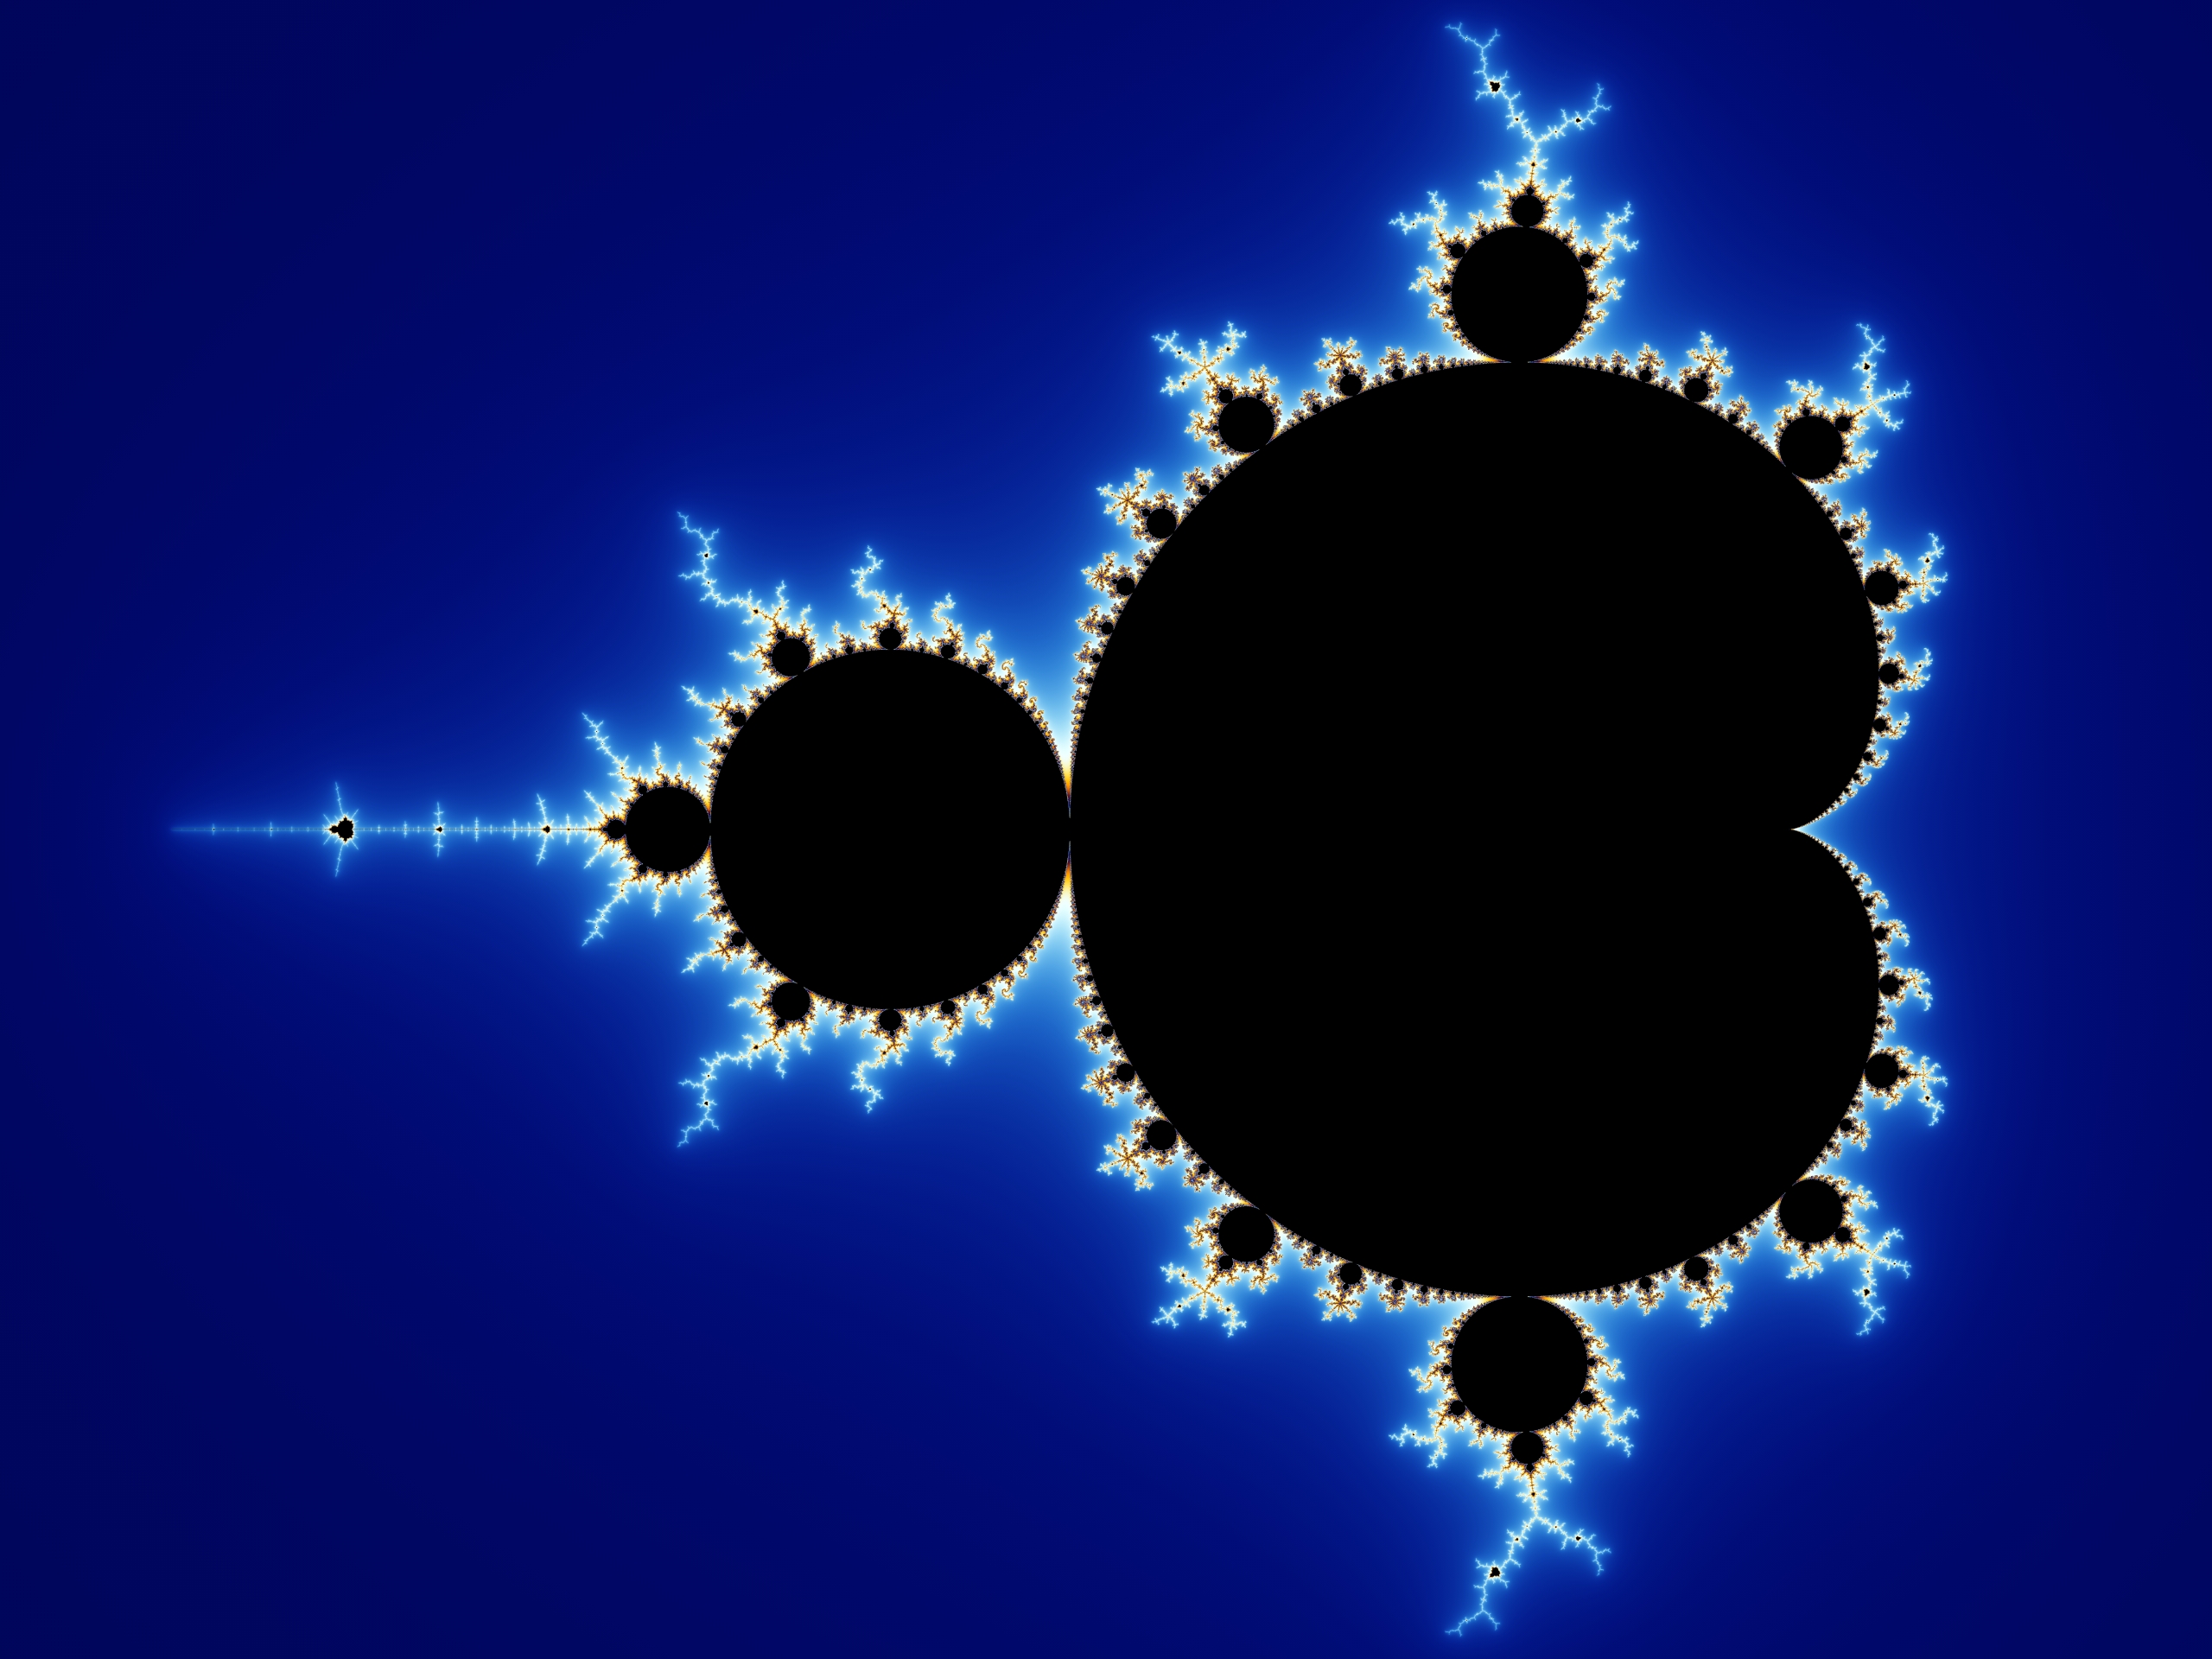
The goal of this little project is to recreate factals (the Mandelbrot and Julia set) with my current knowledge of Python. I might use other languages if I encounter limitations in computation or visualization (possibly using shaders later on).
- Numpy
- Matplotlib
As the project progresses, if I encounter certain limitations or if I aim to enhance the visual aesthetics further, I may explore additional visualization techniques or potentially incorporate advanced features such as shaders. The flexibility of Matplotlib allows me to start with a strong visual foundation and expand upon it as needed.
Project Devlog :
- Add some color and optimisation
- Drawing the Mandelbrot set with Matplotlib.pyplot
- Calculating the value of Zn on the Mandelbrot set
def Computes_Z(complex, max_iterations = 100):
    z = 0
    for i in range(max_iterations):
        z = z * z + complex
        yield z

def ComputesMandelbrot(complex, max_iterations = 100):
    for n, z_nbr in enumerate(Computes_Z(complex, max_iterations)):
        if(abs(z_nbr) > 2.0):
            return n

    return max_iterations


