ToolKit to aggregate extract CSV and post-process data to have useful informations.
Assuming your directory tree is composed of different subfolders, each representing a combination of parameters with multiple CSV file for each simulation performed for that given combination, it is possible to aggregate the data for one combination of parameters into one CSV, getting the mean, median, minimum, maximum, 5th and 95th percentiles, 25th and 975th permilles of the simulations. The commandline, if R is installed and correctly set in the PATH variable, is:
$ Rscript aggregate.R input_folder output_folder nb_step
usage: aggregate.R input_folder output_folder nb_step
with (in that exact order):
- input_folder the parent folder of the data generated by the model
- output_folder the target folder that will contain the resulting CSV files
- nb_step the maximum number of steps for all simulations
Remarks The number of simulations is depending on the number of files named *_building.csv . The CSV files generated by GAMA must have the followin columns, in that exact order, for age categories:
- cumulative incidence,
- number of individuals needing hospitalisations,
- number of individuals needing ICU care,
- number of susceptible individuals,
- number of latent individuals,
- number of asymptomatic individuals,
- number of presymptomatic individuals,
- number of symptomatic individuals,
- number of recovered individuals,
- number of dead individuals, with each row representing the given number for a step of a simulation.
Age categories are expected to be splitted in 5-year gap categories, starting from 0-4, 5-9, up to 95 and over.
For building, generated files are expected to contain one column per type of building, and one row represents the cumulative number of infections that happened in that type of building for a step of a simulation.
Building types are expected to be the following: "","school","shop","place_of_worship","meeting","restaurant","coffee","supermarket","playground","supplypoint","market","industry","hotel","karaoke", with "" being buildings without any type.
Example
$ Rscript aggregate.R ./Documents/batch_output ./Documents/batch_aggregated 5000
$ python3 comokit2png.py -h
usage: $ python3 comokit2png.py [options]

optional arguments:
  -h, --help           show this help message and exit
  -i , --inputFolder   Path to folder where are saved all the COMOKIT CSV files from explorations
                       (default: "./batch_output")
  -o , --outputImg     Where to save output graph (default: "./out" =generate=>
                       "./out[GeneratedNumber].png")
  -r , --replication   Number of replication per value set (default: 1)
  -t , --title         Graph title (default: "Sickness")
  -v, --variance       Enable variance curve (may crap the output index)
  -q, --quiet          Disable verbose mode
  -c , --cores         Number of core to use (default: max number of cores)
  -s , --stepTo        Change step displayed in the graph (default: 24 -> day)
Example
$ python3 comokit2png.py -r 15
Start thread processing...
End thread processing lines [1250,1874] with end index 78
End thread processing lines [3750,4374] with end index 182
End thread processing lines [4375,4999] with end index 208
End thread processing lines [3125,3749] with end index 156
End thread processing lines [625,1249] with end index 52
End thread processing lines [1875,2499] with end index 104
End thread processing lines [2500,3124] with end index 130
End thread processing lines [0,624] with end index 26
Quick view of some processed data :
[[0.0, 5.173473400326364, 1.8029166666666667], [0.0, 4.993635954093533, 1.7294444444444443], [0.0, 4.754431153532447, 1.6365277777777778], [0.0, 4.471400583146602, 1.5452777777777778], [0.0, 4.129035519792004, 1.4243055555555555], [0.0, 3.889033404286446, 1.3491666666666666], [0.0, 3.7386966700294524, 1.2872222222222223], [0.0, 3.6189690016329825, 1.2236111111111112], [0.0, 3.4333828245277527, 1.15625], [0.0, 3.209235681672384, 1.0702777777777779]]
Processed 220 days
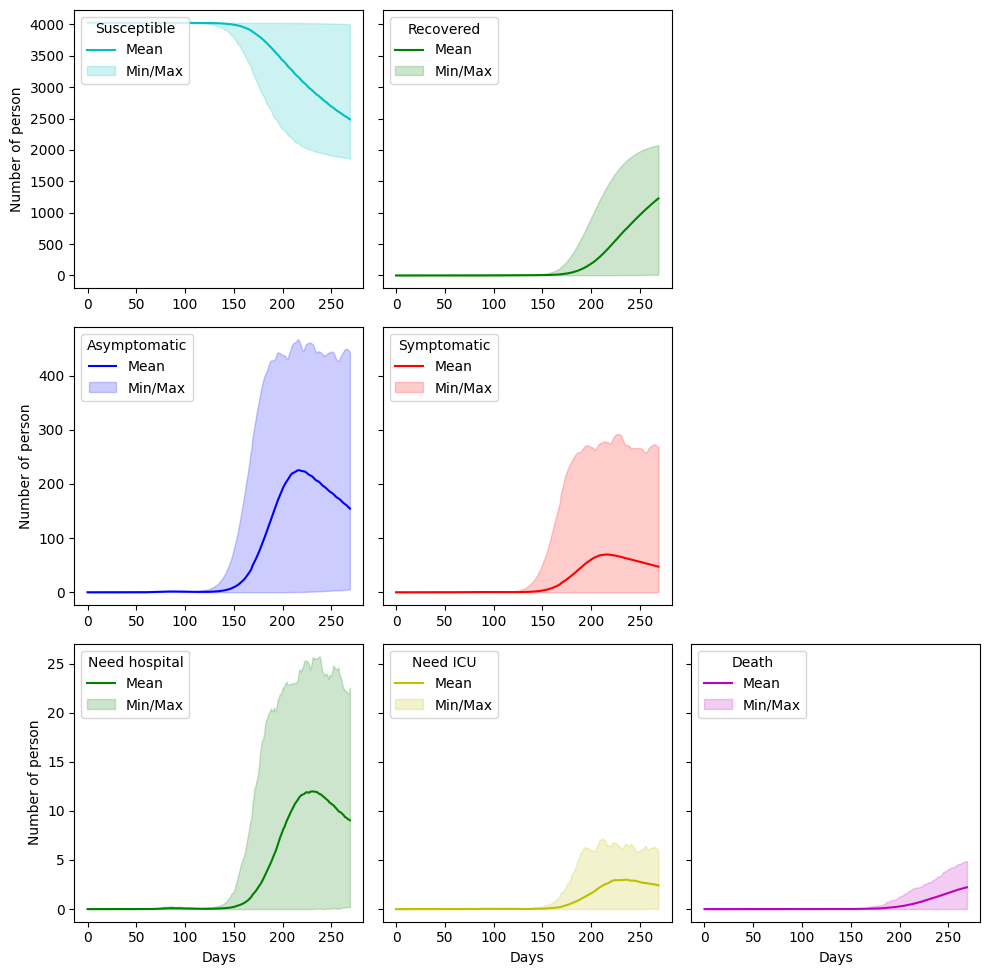
Creating plot...
Output image saved as : ./out.png
- Damien Philippon - Epidemiologist developer - DAM-Philippon
See also the list of contributors who participated in this project.